Topic: Angular Bootstrap Charts - how to properly fill [colors] array?

*_Expected behavior_*I want to be able to change the colors of a Bootstrap Doughnut chart in my Angular web application. The documentation says that [colors] should point to an object or array in the typescript component.
html:
<canvas baseChart height="180px" [data]="doughnutChartData" [labels]="doughnutChartLabels"
    [chartType]="doughnutChartType" (chartHover)="chartHovered($event)" (chartClick)="chartClicked($event)"
    **[colors]="chartColors"**>
    </canvas>
I followed an example color array from "lineChartColors" that I found in SB Admin Bootstrap Angular 6 demo application:
typescript
public chartColors: Array<any> = [
    {
        // grey
        backgroundColor: 'rgba(148,159,177,0.2)',
        borderColor: 'rgba(148,159,177,1)',
        pointBackgroundColor: 'rgba(148,159,177,1)',
        pointBorderColor: '#fff',
        pointHoverBackgroundColor: '#fff',
        pointHoverBorderColor: 'rgba(148,159,177,0.8)'
    },
    {
        // green
        backgroundColor: 'rgba(52,172,48,0.2)',
        borderColor: 'rgba(77,83,96,1)',
        pointBackgroundColor: 'rgba(52,172,48,0.2)',
        pointBorderColor: '#fff',
        pointHoverBackgroundColor: '#fff',
        pointHoverBorderColor: 'rgba(77,83,96,1)'
    },
    {
        // yellow
        backgroundColor: 'rgba(255,255,92,0.2)',
        borderColor: 'rgba(148,159,177,1)',
        pointBackgroundColor: 'rgba(255,255,92,0.2)',
        pointBorderColor: '#fff',
        pointHoverBackgroundColor: '#fff',
        pointHoverBorderColor: 'rgba(148,159,177,0.8)'
    },
        // red
        backgroundColor: 'rgba(216,40,10,0.2)',
        borderColor: 'rgba(148,159,177,1)',
        pointBackgroundColor: 'rgba(216,40,10,0.2)',
        pointBorderColor: '#fff',
        pointHoverBackgroundColor: '#fff',
        pointHoverBorderColor: 'rgba(148,159,177,0.8)'
    }
];
*_Actual behavior_*
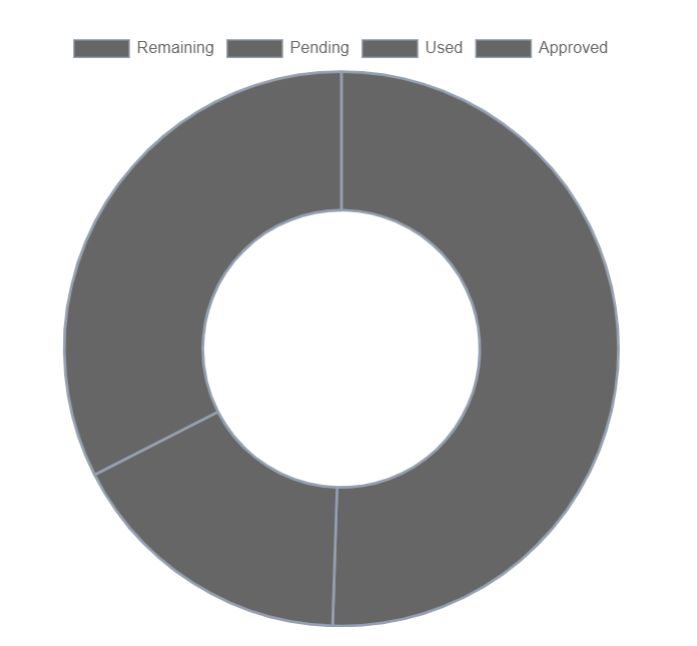
No matter how much I tweak the colors, the doughnut chart populates in just a single color. Is there something wrong in my formatting? I couldn't find a shred of documentation on how to fill the color array anywhere. Any help is appreciated.

You should add the colors definitions to the specific arrays in chartColors array. Please take a look at the example in our documentation:
https://mdbootstrap.com/docs/angular/advanced/charts/#doughnut-chart
Whoops, I completely missed that there was a 'TS' button to click that showed exactly how everyone worked. Thanks for the answer!
FREE CONSULTATION
Hire our experts to build a dedicated project. We'll analyze your business requirements, for free.
Resolved
- ForumUser: Free
- Premium support: No
- Technology: MDB Angular
- MDB Version: 6.3.0
- Device: Computer
- Browser: Google Chrome
- OS: Windows 10
- Provided sample code: No
- Provided link: No