Topic: Format displayed Bar Chart number values during hover

In Bar Chart, how can I format the displayed number values during hover? Please see attached screenshot.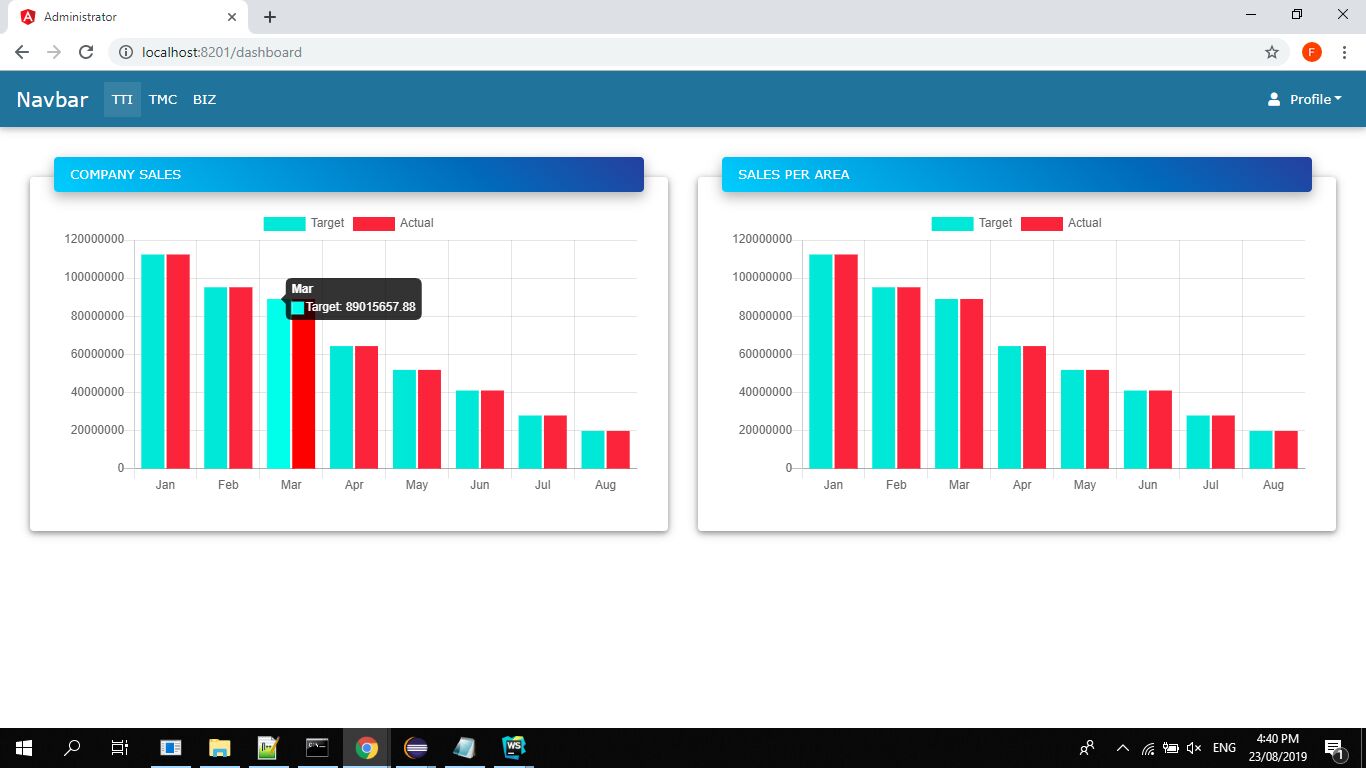

Hi!
For Stacked Bar Chart you have to specify second data in chartDatasets, and chartColors - for second Bar Chart, as in the documentation example:
https://mdbootstrap.com/docs/angular/advanced/charts/
Here is my work around for this, and it seems to work:
TS:
public chartType = 'bar';

  public chartDatasets: Array<any> = [
    {
      data: [4568.21, 4562.298, 4563.23, 4567.11, 4567.54, 4564.28, 4559.11],
      label: 'FirstTarget',
    },
    {
      data: [4228.95, 3562.22, 4863.12, 4277.291, 4547.17, 4561.36, 4421.91],
      label: 'SecondTarget',
    },
  ];

  public chartLabels: Array<any> = ['Red', 'Blue', 'Yellow', 'Green', 'Purple', 'Orange'];

  public chartColors: Array<any> = [
    {
      backgroundColor: [
        'rgba(255, 99, 132, 0.2)',
        'rgba(54, 162, 235, 0.2)',
        'rgba(255, 206, 86, 0.2)',
        'rgba(75, 192, 192, 0.2)',
        'rgba(153, 102, 255, 0.2)',
        'rgba(255, 159, 64, 0.2)',
      ],
      borderColor: [
        'rgba(255,99,132,1)',
        'rgba(54, 162, 235, 1)',
        'rgba(255, 206, 86, 1)',
        'rgba(75, 192, 192, 1)',
        'rgba(153, 102, 255, 1)',
        'rgba(255, 159, 64, 1)',
      ],
      borderWidth: 2,
    },
    {
      backgroundColor: [
        'rgba(255, 125, 158, 0.2)',
        'rgba(3, 111, 184, 0.2)',
        'rgba(255, 255, 137, 0.2)',
        'rgba(75, 192, 192, 0.2)',
        'rgba(126, 243, 243, 0.2)',
        'rgba(255, 210, 115, 0.2)',
      ],
      borderColor: [
        'rgba(255, 125, 158, 1)',
        'rgba(3, 111, 184, 1)',
        'rgba(255, 255, 137, 1)',
        'rgba(75, 192, 192, 1)',
        'rgba(126, 243, 243, 1)',
        'rgba(255, 210, 115, 1)',
      ],
      borderWidth: 2,
    },
  ];

  public chartOptions: any = {
    responsive: true,
    scales: {
      xAxes: [
        {
          stacked: true,
        },
      ],
      yAxes: [
        {
          stacked: true,
        },
      ],
    },
    tooltips: {
      // Disable the on-canvas tooltip
      enabled: false,

      custom: function(tooltipModel: any) {
        // Tooltip Element
        let tooltipEl = document.getElementById('chartjs-tooltip');

        // Create element on first render
        if (!tooltipEl) {
          tooltipEl = document.createElement('div');
          tooltipEl.id = 'chartjs-tooltip';
          tooltipEl.innerHTML = '<table></table>';
          document.body.appendChild(tooltipEl);
        }

        // Hide if no tooltip
        if (tooltipModel.opacity === 0) {
          tooltipEl.style.opacity = '0';
          return;
        }

        // Set caret Position
        tooltipEl.classList.remove('above', 'below', 'no-transform');
        if (tooltipModel.yAlign) {
          tooltipEl.classList.add(tooltipModel.yAlign);
        } else {
          tooltipEl.classList.add('no-transform');
        }

        function getBody(bodyItem: { lines: any }) {
          return bodyItem.lines;
        }

        // Set Text
        if (tooltipModel.body) {
          const titleLines = tooltipModel.title || [];
          const bodyLines = tooltipModel.body.map(getBody);

          let innerHtml = '<thead>';

          titleLines.forEach(function(title: string) {
            innerHtml += '<tr><th>' + title + '</th></tr>';
          });
          innerHtml += '</thead><tbody>';

          bodyLines.forEach(function(body: string, i: string | number) {
            const num = body[0].split(' ')[1];
            console.log(num);
            const colors = tooltipModel.labelColors[i];
            let style = 'background-color:' + colors.backgroundColor;
            style += '; border-color:' + colors.borderColor;
            style += '; border-width: 2px';
            const span = '<span class="chartjs-tooltip-key" style="' + style + '"></span>';
            innerHtml +=
              '<tr><td>' + span + num.replace(/\B(?=(\d{3})+(?!\d))/g, ',') + '</td></tr>';
          });
          innerHtml += '</tbody>';

          const tableRoot = tooltipEl.querySelector('table');
          if (tableRoot) {
            tableRoot.innerHTML = innerHtml;
          }
        }

        // `this` will be the overall tooltip
        const position = this._chart.canvas.getBoundingClientRect();

        // Display, position, and set styles for font
        tooltipEl.style.opacity = '1';
        tooltipEl.style.position = 'absolute';
        tooltipEl.style.left = position.left + window.pageXOffset + tooltipModel.caretX + 'px';
        tooltipEl.style.top = position.top + window.pageYOffset + tooltipModel.caretY + 'px';
        tooltipEl.style.fontFamily = tooltipModel._bodyFontFamily;
        tooltipEl.style.fontSize = tooltipModel.bodyFontSize + 'px';
        tooltipEl.style.fontStyle = tooltipModel._bodyFontStyle;
        tooltipEl.style.padding = tooltipModel.yPadding + 'px ' + tooltipModel.xPadding + 'px';
        tooltipEl.style.pointerEvents = 'none';
      },
    },
  };
  public chartClicked(e: any): void {}
  public chartHovered(e: any): void {}
HTML:
<div style="display: block">
  <canvas
    mdbChart
    [chartType]="chartType"
    [datasets]="chartDatasets"
    [labels]="chartLabels"
    [colors]="chartColors"
    [options]="chartOptions"
    [legend]="true"
    (chartHover)="chartHovered($event)"
    (chartClick)="chartClicked($event)"
  >
  </canvas>
</div>
styles.scss:
#chartjs-tooltip {
  opacity: 1;
  position: absolute;
  background: rgba(0, 0, 0, 0.7);
  color: white;
  border-radius: 3px;
  -webkit-transition: all 0.1s ease;
  transition: all 0.1s ease;
  pointer-events: none;
  -webkit-transform: translate(-50%, 0);
  transform: translate(-50%, 0);
}
.chartjs-tooltip-key {
  display: inline-block;
  width: 15px;
  height: 15px;
  margin-right: 10px;
}
Hope it helps!
Best Regards, Bartosz.
Dear @1001albertpadilla
To make the effect you want, you have to use custom tooltips, which allows you to hook into the tooltip rendering process so that you can render the tooltip in your own custom way. Here is my example (including format the number to be displayed as ~ 1,234,567.00)
HTML:
<div style="display: block">
  <canvas
    mdbChart
    [chartType]="chartType"
    [datasets]="chartDatasets"
    [labels]="chartLabels"
    [colors]="chartColors"
    [options]="chartOptions"
    [legend]="true"
    (chartHover)="chartHovered($event)"
    (chartClick)="chartClicked($event)"
  >
  </canvas>
</div>
TS:
  public chartType: string = 'bar';

  public chartDatasets: Array<any> = [
    {
      data: [1234568.21, 1234562.298, 1234563.23, 1234567.41, 1234567.54, 1234564.28, 1234559.11],
      label: 'target',
    },
  ];

  public chartLabels: Array<any> = ['Red', 'Blue', 'Yellow', 'Green', 'Purple', 'Orange'];

  public chartColors: Array<any> = [
    {
      backgroundColor: [
        'rgba(255, 99, 132, 0.2)',
        'rgba(54, 162, 235, 0.2)',
        'rgba(255, 206, 86, 0.2)',
        'rgba(75, 192, 192, 0.2)',
        'rgba(153, 102, 255, 0.2)',
        'rgba(255, 159, 64, 0.2)',
      ],
      borderColor: [
        'rgba(255,99,132,1)',
        'rgba(54, 162, 235, 1)',
        'rgba(255, 206, 86, 1)',
        'rgba(75, 192, 192, 1)',
        'rgba(153, 102, 255, 1)',
        'rgba(255, 159, 64, 1)',
      ],
      borderWidth: 2,
    },
  ];

  public chartOptions: any = {
    responsive: true,
    tooltips: {
      // Disable the on-canvas tooltip
      enabled: false,

      custom: function(tooltipModel: any) {
        // Tooltip Element
        let tooltipEl = document.getElementById('chartjs-tooltip');

        // Create element on first render
        if (!tooltipEl) {
          tooltipEl = document.createElement('div');
          tooltipEl.id = 'chartjs-tooltip';
          tooltipEl.innerHTML = '<table></table>';
          document.body.appendChild(tooltipEl);
        }

        // Hide if no tooltip
        if (tooltipModel.opacity === 0) {
          tooltipEl.style.opacity = '0';
          return;
        }

        // Set caret Position
        tooltipEl.classList.remove('above', 'below', 'no-transform');
        if (tooltipModel.yAlign) {
          tooltipEl.classList.add(tooltipModel.yAlign);
        } else {
          tooltipEl.classList.add('no-transform');
        }

        function getBody(bodyItem: { lines: any }) {
          return bodyItem.lines;
        }

        // Set Text
        if (tooltipModel.body) {
          const titleLines = tooltipModel.title || [];
          const bodyLines = tooltipModel.body.map(getBody);

          let innerHtml = '<thead>';

          titleLines.forEach(function(title: string) {
            innerHtml += '<tr><th>' + title + '</th></tr>';
          });
          innerHtml += '</thead><tbody>';

          bodyLines.forEach(function(body: string, i: string | number) {
            const num = body[0].split(' ')[1];
            console.log(num);
            const colors = tooltipModel.labelColors[i];
            let style = 'background-color:' + colors.backgroundColor;
            style += '; border-color:' + colors.borderColor;
            style += '; border-width: 2px';
            const span = '<span class="chartjs-tooltip-key" style="' + style + '"></span>';
            innerHtml +=
              '<tr><td>' + span + num.replace(/\B(?=(\d{3})+(?!\d))/g, ',') + '</td></tr>';
          });
          innerHtml += '</tbody>';

          const tableRoot = tooltipEl.querySelector('table');
          if (tableRoot) {
            tableRoot.innerHTML = innerHtml;
          }
        }

        // `this` will be the overall tooltip
        const position = this._chart.canvas.getBoundingClientRect();

        // Display, position, and set styles for font
        tooltipEl.style.opacity = '1';
        tooltipEl.style.position = 'absolute';
        tooltipEl.style.left = position.left + window.pageXOffset + tooltipModel.caretX + 'px';
        tooltipEl.style.top = position.top + window.pageYOffset + tooltipModel.caretY + 'px';
        tooltipEl.style.fontFamily = tooltipModel._bodyFontFamily;
        tooltipEl.style.fontSize = tooltipModel.bodyFontSize + 'px';
        tooltipEl.style.fontStyle = tooltipModel._bodyFontStyle;
        tooltipEl.style.padding = tooltipModel.yPadding + 'px ' + tooltipModel.xPadding + 'px';
        tooltipEl.style.pointerEvents = 'none';
      },
    },
  };
  public chartClicked(e: any): void {}
  public chartHovered(e: any): void {}
styles.scss:
#chartjs-tooltip {
  opacity: 1;
  position: absolute;
  background: rgba(0, 0, 0, 0.7);
  color: white;
  border-radius: 3px;
  -webkit-transition: all 0.1s ease;
  transition: all 0.1s ease;
  pointer-events: none;
  -webkit-transform: translate(-50%, 0);
  transform: translate(-50%, 0);
}
.chartjs-tooltip-key {
  display: inline-block;
  width: 15px;
  height: 15px;
  margin-right: 10px;
}
For more information, please refer to: https://www.chartjs.org/docs/latest/configuration/tooltip.html#external-custom-tooltips
Hope it helps!
Best Regards, Bartosz.
1001albertpadilla pro commented 7 years ago
Thanks! The solution works for Bar Chart. But when I tried to mix it with this Stacked Bar Chart codes, the solution doesn't work.
public chartOptions: any = { responsive: true, scales: { xAxes: [{ stacked: true }], yAxes: [ { stacked: true } ] } };
Is there a way to work around this for Stacked Bar Chart? Thanks!
FREE CONSULTATION
Hire our experts to build a dedicated project. We'll analyze your business requirements, for free.
Answered
- ForumUser: Pro
- Premium support: No
- Technology: MDB Angular
- MDB Version: 7.5.3
- Device: Laptop
- Browser: Chrome
- OS: Win 10
- Provided sample code: No
- Provided link: No
Bartosz Termena staff commented 7 years ago
Dear @1001albertpadilla
How do you want to format the displayed number values? Could you give me an example?
Best Regards, Bartosz.
1001albertpadilla pro commented 7 years ago
This is the number data that I'm passing to the Bar Chart -- 1234567.00 -- I want the number to be displayed as -- 1,234,567.00
I tried formatting the number, but after formatting it became a string. Bar Chart doesn't accept strings. It only takes in numbers. Is there a way to work around this? Thanks.
Bartosz Termena staff commented 7 years ago
Dear @1001albertpadilla
Unfortunately, ChartJS does not accept string as data. At the moment there is no a way to work around.
We will try to add an opportunity to format numbers to strings in ChartJS in the future.
Best Regards, Bartosz.
1001albertpadilla pro commented 7 years ago
Can you please provide any suggestions? I need to get the numbers formatted. Thanks.