Topic: Different Bar Chart style

Is there any way to create a chart to show the times a boiler is on or off during the day?
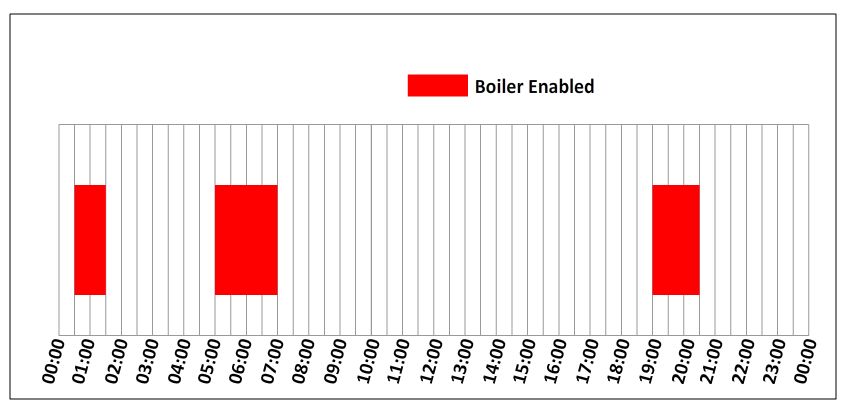
Maybe by passing a start time and duration or start time and end time? Something similar to the attached image is what I'm looking for. Thanks

Hello!
I'm afraid you can't change bar width like in the picture, but maybe you can try do something like this? https://www.chartjs.org/samples/latest/scales/time/financial.html You can instead of days of month put hours and instead of price - two states, for example 1 (on) and 0 (off).
Krzysztof Wilk staff commented 7 years ago
Or you can do something like this https://mdbootstrap.com/snippets/jquery/pjoter-2-0/818662
I'm glad I could help :D maybe try to operate on div, that your chart is in? I mean try to make something like this:
<div class="div-for-your-chart">
    Here's your chart's code
</div>
Then try to change height of <div class="div-for-your-chart">.
Or maybe try to operate on bootstrap grid? Try to put this chart in col-md-6 or something.
Thanks, I was successfully able to tweek your solution for my project. I am passing a list of strings representing on and off to my page from my server however, instead of passing "On" and "Off", I'm passing "On" or an empty string. This has the effect of creating gaps where it is off, rather than diagonally drawing a line to the centre of the Off point. Here's my code:
var boilerChartData = @Html.Raw(Json.Serialize(Model.BoilerChartData));
    var times = [];
    for (var i = 0; i < 24; i++) {
        for (var j = 0; j < 60; j++) {
            if (i < 10) {
                if (j < 10) {
                    times.push("0" + i + ":0" + j);
                } else {
                    times.push("0" + i + ":" + j);
                }

            } else {
                if (j < 10) {
                    times.push(i + ":0" + j);
                } else {
                    times.push(i + ":" + j);
                }
            }
        }
    }
    var ctx = document.getElementById("myChart").getContext('2d');
    var myChart = new Chart(ctx, {
        type: 'line',
        data: {
            xLabels: times,
            yLabels: ['On', 'Off'],
            datasets: [{
                label: 'Boiler Enabled',
                backgroundColor: '#9c2c2c',
                data: boilerChartData,
                pointBorderColor: "transparent",
                pointBackgroundColor: "transparent",
            }],

        },
        options: {
            scales: {
                yAxes: [{
                    type: 'category',
                    position: 'left',
                    display: true,

                }],
            }
        }
    });
Here's a screenshot of the chart: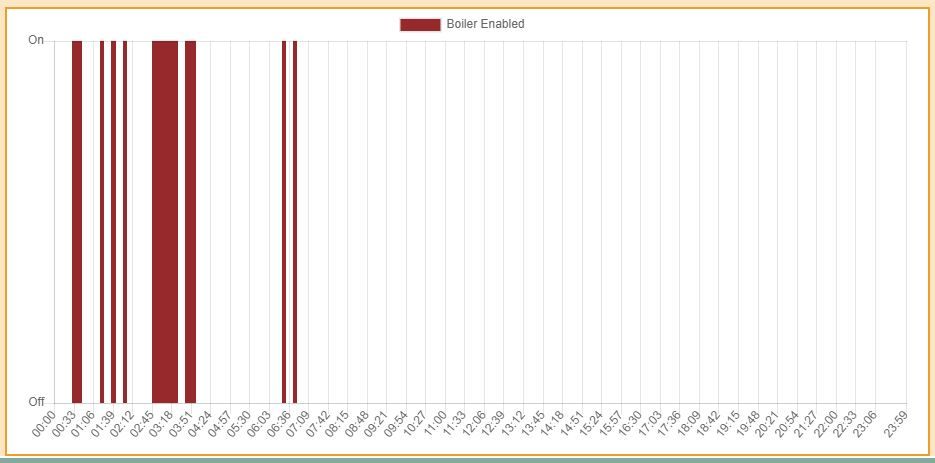 One last query: The chart is the full width of my page which is fine, however it is too tall. I tried setting a height but it had the effect of squashing the chart, including the text, like an image that has been resized with out constraint. I simply want to make the max height a fixed size.
Thanks again.Eoin :)
FREE CONSULTATION
Hire our experts to build a dedicated project. We'll analyze your business requirements, for free.
Answered
- ForumUser: Free
- Premium support: No
- Technology: MDB jQuery
- MDB Version: 4.8.2
- Device: PC
- Browser: Chrome
- OS: Win 10
- Provided sample code: No
- Provided link: No