Topic: Chart options

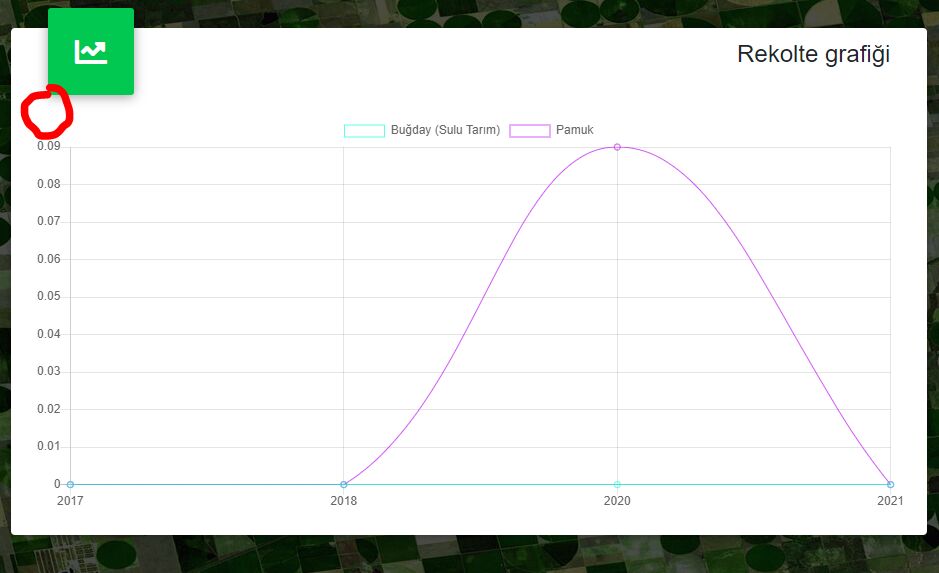
Hi, I am trying to add unit information (kg,meter,liter etc.) on y - axis values. Either top of graph or every value below red circle. I can't manage to do it. there is an example on charts page called Scatter Chart but the example and the code below are different.
Can you help me on this matter?
Thank you,

Hi there,
You need to add ticks object to yAxes options object. Here's an example:
      yAxes: [
        {
          gridLines: {
            display: true,
            color: "rgba(0, 0, 0, 0.1)"
          },
          ticks: {
            userCallback: function (tick) {
              return tick.toString() + 'dB';
            }
          }
        }
      ]
Best regards
FREE CONSULTATION
Hire our experts to build a dedicated project. We'll analyze your business requirements, for free.
Resolved
- ForumUser: Premium
- Premium support: Yes
- Technology: MDB Vue
- MDB Version: 6.6.0
- Device: computer
- Browser: chrome
- OS: windows
- Provided sample code: No
- Provided link: Yes