Topic: Line chart issue

Expected behavior Multiple lines in one chart, with independent data
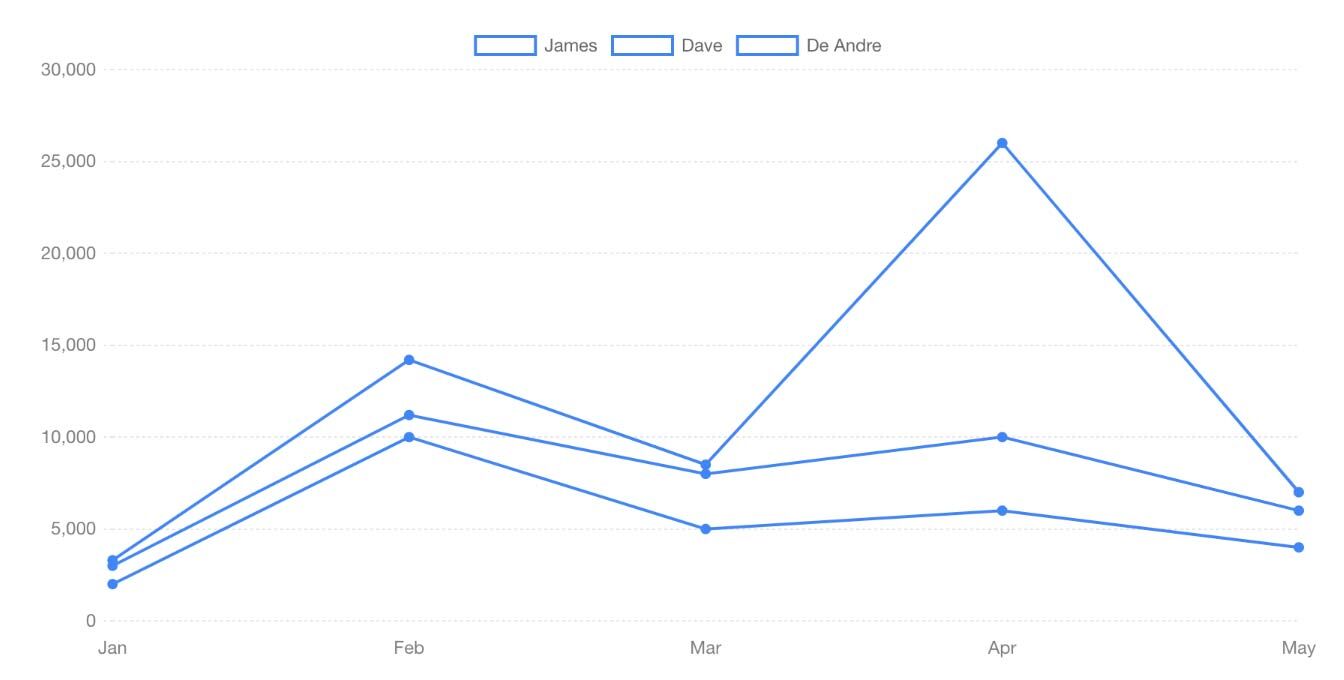
Actual behavior The data is added together, so that each successive entry in the datasets is the cumulative total of every entry.
Resources (screenshots, code snippets etc.)
You can see most easily from below that for April, the combine total is 26,000, which is what was charted in the screenshot, in addition to 6000 and 10,000 (the total of the first two data)...
setup(){
const lineChartData = ref({
  labels: ['Jan', 'Feb', 'Mar', 'Apr', 'May'],
  datasets: [
    {
      label: 'James',
      data: [2000, 10000, 5000, 6000, 4000],
      order: 1
    },
    {
      label: 'Dave',
      data: [1000, 1200, 3000, 4000, 2000],
      order: 2
    },
    {
      label: 'De Andre',
      data: [300, 3000, 500, 16000, 1000],
      order: 3
    }
  ]
})

Hi @jeffreykthomas,
Thank you for your report, it seems that in our Charts config stacked value for axes is by default set to true. We will fix that for the future releases but until that time please add the following line to your setup function and bind it to the :options property of your chart:
   const lineChartOptions = ref({
      scales: {
        y: {
          stacked: false
        },
        x: {
          stacked: false
        }
      }
    });
Keep coding, Marcin from MDB
FREE CONSULTATION
Hire our experts to build a dedicated project. We'll analyze your business requirements, for free.
Resolved
- ForumUser: Premium
- Premium support: Yes
- Technology: MDB Vue
- MDB Version: MDB5 1.0.0-beta6
- Device: Mac
- Browser: Chrome
- OS: OS 11.4
- Provided sample code: No
- Provided link: No