Topic: Card Flipping - Reveal side having chart

Expected behaviour
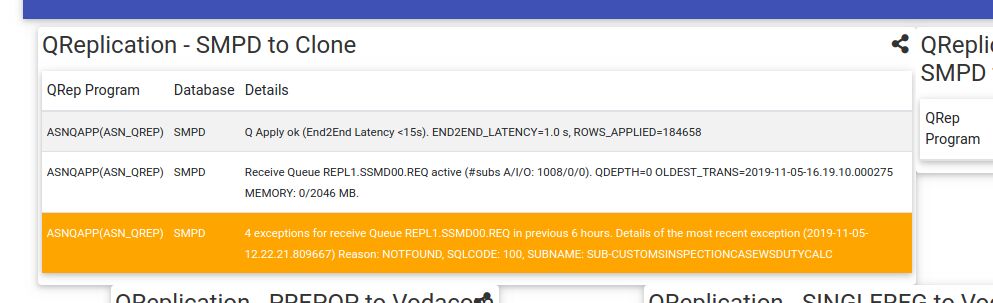
Showing Line Chart on Card Flip Side - Reveal version of Card Flipping
Actual behaviour
To fit Canvas of Line chart on the flip side of Card
Resources (screenshots, code snippets etc.)
Parent Component:
  *<!-- Card reveal -->
  <div class="card-reveal white">
    <!-- Content -->
    <span class="d-flex justify-content-between">
      <span class="w-100 mx-2">
        <!-- Backend of Card -->
        <app-graphdata [schema]="sch1"></app-graphdata>
      </span>
      <a class="flex-shrink-1 activator mr-2 mt-2"><mdb-icon fas icon="times" class="text-muted" (click)="card1.toggle()"></mdb-icon></a>
    </span>
  </div>
  <!-- Card reveal -->*
Child Component
<mdb-card>
  <mdb-card-body>
    <div style="display: block">
        <canvas mdbChart
        [chartType]="chartType"
        [datasets]="chartDatasets"
        [labels]="chartLabels"
        [colors]="chartColors"
        [options]="chartOptions"
        [legend]="true"
        (chartHover)="chartHovered($event)"
        (chartClick)="chartClicked($event)">
      </canvas>
    </div>
  </mdb-card-body>
</mdb-card>
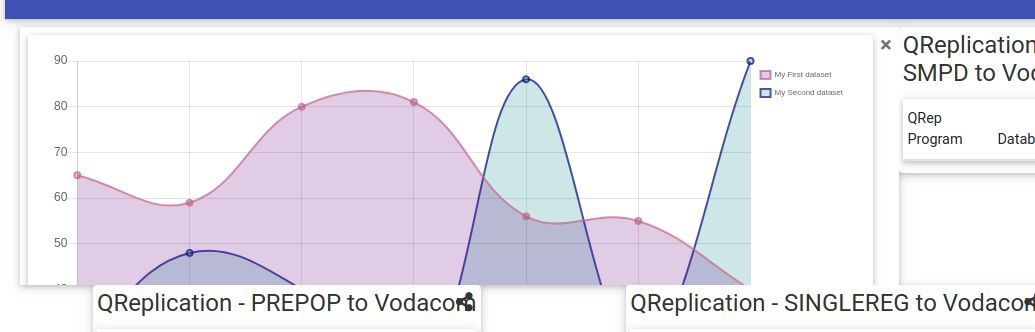
As can been seen, the default Line Chart only fits partially on the Reveal Side of the Flip Card.
Here within my code that I'm using for the Parent Component
<div class="d-flex flex-column">
  <div class="d-flex justify-content-around">
    <mdb-card-reveal #card1>
      <!-- Card front -->
      <div class="card card-front">
        <!--Card content-->
        <div class="card-body mb-n2 p-1">
          <span class="d-flex justify-content-between">
            <h4 class="card-title">QReplication - SMPD to Clone</h4>
            <a class="activator mr-2">
              <mdb-icon fas icon="share-alt" (click)="card1.toggle()"></mdb-icon>
            </a>
          </span>
          <table mdbTable #tableEl="mdbTable" striped="true" small="true" responsive="true" class="z-depth-1" >
            <thead>
            <tr>
              <th *ngFor="let head of qheaders; let i = index" scope="col">{{head}} </th>
            </tr>
            </thead>
            <tbody #row>
              <tr mdbTableCol *ngFor="let el of qdata1; let i = index" [ngClass]="el.serv === 'INFO' ? null : el.serv === 'WARNING' ? 'warning' : 'error'">
              <td scope="row"><small>{{el.prg}}</small></td>
              <td><small>{{el.db}}</small></td>
              <!-- <td><small>{{el.serv}}</small></td> -->
              <td><small>{{el.mesg}}</small></td>
            </tr>
            </tbody>
          </table>
        </div>
        <!--/.Card content-->
      </div>
      <!--/.Card Front-->
      <!-- Card reveal -->
      <div class="card-reveal white">
        <!-- Content -->
        <span class="d-flex justify-content-between">
          <span class="w-100 h-100 mx-2">
            <!-- Backend of Card -->
            <app-graphdata [schema]="sch1"></app-graphdata>
          </span>
          <a class="flex-shrink-1 activator mr-2 mt-2"><mdb-icon fas icon="times" class="text-muted" (click)="card1.toggle()"></mdb-icon></a>
        </span>
      </div>
      <!-- Card reveal -->
    </mdb-card-reveal>
    <mdb-card-reveal #card2>
      <!-- Card front -->
      <div class="card card-front">
        <!--Card content-->
        <div class="card-body mb-n2 p-1">
          <span class="d-flex justify-content-between">
            <h4 class="card-title">QReplication - SMPD to Vodacom</h4>
            <a class="activator mr-2">
              <mdb-icon fas icon="share-alt" (click)="card2.toggle()"></mdb-icon>
            </a>
          </span>
          <table mdbTable #tableEl="mdbTable" striped="true" small="true" responsive="true" class="z-depth-1" >
            <thead>
            <tr>
              <th *ngFor="let head of qheaders; let i = index" scope="col">{{head}} </th>
            </tr>
            </thead>
            <tbody #row>
              <tr mdbTableCol *ngFor="let el of qdata4; let i = index" [ngClass]="el.serv === 'INFO' ? null : el.serv === 'WARNING' ? 'warning' : 'error'">
              <td scope="row"><small>{{el.prg}}</small></td>
              <td><small>{{el.db}}</small></td>
              <!-- <td><small>{{el.serv}}</small></td> -->
              <td><small>{{el.mesg}}</small></td>
            </tr>
            </tbody>
          </table>
        </div>
        <!--/.Card content-->
      </div>
      <!--/.Card Front-->
      <!-- Card reveal -->
      <div class="card-reveal white">
        <!-- Content -->
        <span class="d-flex justify-content-between">
            <span class="w-100 mx-2">
              <!-- Backend of Card -->
              <app-graphdata [schema]="sch1"></app-graphdata>
            </span>
            <a class="activator mr-2 mt-2"><mdb-icon fas icon="times" class="text-muted" (click)="card2.toggle()"></mdb-icon></a>
        </span>
      </div>
      <!-- Card reveal -->
    </mdb-card-reveal>
  </div>
app-graphdata Component
<div class="d-flex p-0 m-0">
  <div class="flex-fill py-1 my-1">
    <mdb-card>
      <mdb-card-body>
        <!-- <div style="display: block"> -->
            <canvas mdbChart
            [chartType]="chartType"
            [datasets]="chartDatasets"
            [labels]="chartLabels"
            [colors]="chartColors"
            [options]="chartOptions"
            [legend]="true"
            (chartHover)="chartHovered($event)"
            (chartClick)="chartClicked($event)">
          </canvas>
        <!-- </div> -->
      </mdb-card-body>
    </mdb-card>
  </div>
</div>

Dear @Jan Louw
The reason for the wrong positioning of charts is removal of the image. Here is my solution for your example: HTML
<div class="container-fluid">
<div class="row">
<div class="col-md-6">
<mdb-card-reveal #cards>
<!-- Card front -->
<div class="card card-front">
<!--Card content-->
<div class="card-body mb-n2 p-1">
<span class="d-flex justify-content-between">
<h4 class="card-title">CARD 1</h4>
<a class="activator mr-2">
<mdb-icon fas icon="share-alt" (click)="cards.toggle()"></mdb-icon>
</a>
</span>
<div class="table-responsive">
<table mdbTable>
<thead>
<tr>
<th *ngFor="let head of headElements" scope="col">{{ head }}</th>
</tr>
</thead>
<tbody>
<tr mdbTableCol *ngFor="let el of elements">
<th scope="row">{{ el.id }}</th>
<td>{{ el.first }}</td>
<td>{{ el.last }}</td>
<td>{{ el.handle }}</td>
<td>{{ el.first }}</td>
<td>{{ el.last }}</td>
<td>{{ el.handle }}</td>
<td>{{ el.first }}</td>
<td>{{ el.last }}</td>
</tr>
</tbody>
</table>
</div>
</div>
<!--/.Card content-->
</div>
<!--/.Card Front-->
<!-- Card reveal -->
<div class="card-reveal white">
<!-- Content -->
<h4 class="card-title font-weight-bold py-4">
More Square - Chart OK
<mdb-icon fas icon="times" class="text-muted" (click)="cards.toggle()"></mdb-icon>
</h4>
<hr />
<div style="max-width:550px; height: auto;text-align: center; ">
<canvas
style=" padding: 0;
margin: auto;
display: block;
position: absolute;
bottom: 0;
left: 0;
right: 0;"
mdbChart
[chartType]="chartType"
[datasets]="chartDatasets"
[labels]="chartLabels"
[colors]="chartColors"
[options]="chartOptions"
[legend]="true"
(chartHover)="chartHovered($event)"
(chartClick)="chartClicked($event)"
>
</canvas>
</div>
</div>
</mdb-card-reveal>
</div>
<div class="col-md-6">
<mdb-card-reveal #card2>
<!-- Card front -->
<div class="card card-front">
<!--Card content-->
<div class="card-body mb-n2 p-1">
<span class="d-flex justify-content-between">
<h4 class="card-title">CARD 2</h4>
<a class="activator mr-2">
<mdb-icon fas icon="share-alt" (click)="card2.toggle()"></mdb-icon>
</a>
</span>
<table mdbTable>
<thead>
<tr>
<th *ngFor="let head of headElement2" scope="col">{{ head }}</th>
</tr>
</thead>
<tbody>
<tr mdbTableCol *ngFor="let el of elements">
<th scope="row">{{ el.id }}</th>
<td>{{ el.first }}</td>
<td>{{ el.last }}</td>
<td>{{ el.handle }}</td>
</tr>
</tbody>
</table>
</div>
<!--/.Card content-->
</div>
<!--/.Card Front-->
<!-- Card reveal -->
<div class="card-reveal white">
<!-- Content -->
<span class="d-flex justify-content-between">
<span class="w-100 h-100 mx-2">
<h4 class="card-title font-weight-bold py-4">
More Square - Chart OK
<mdb-icon fas icon="times" class="text-muted" (click)="card2.toggle()"></mdb-icon>
</h4>
<hr />
<div style="max-width:550px; height: auto;text-align: center; ">
<canvas
style=" padding: 0;
margin: auto;
display: block;
position: absolute;
bottom: 0;
left: 0;
right: 0;"
mdbChart
[chartType]="chartType"
[datasets]="chartDatasets"
[labels]="chartLabels"
[colors]="chartColors"
[options]="chartOptions"
[legend]="true"
(chartHover)="chartHovered($event)"
(chartClick)="chartClicked($event)"
>
</canvas>
</div> </span
></span>
</div>
<!-- Card reveal -->
</mdb-card-reveal>
</div>
</div>
</div>
TS like in your example
Jan Louw pro commented 6 years ago
Dear Bartosz, I've taken note of your solution and will try and implement it. Regards
Code base on your sample
<div class="d-flex flex-column">
<div class="d-flex justify-content-around">
<mdb-card-reveal #card1>
<!-- Card front -->
<div class="card card-front">
<!--Card content-->
<div class="card-body mb-n2 p-1">
<span class="d-flex justify-content-between">
<h4 class="card-title">CARD 1</h4>
<a class="activator mr-2">
<mdb-icon fas icon="share-alt" (click)="card1.toggle()"></mdb-icon>
</a>
</span>
<table mdbTable>
<thead>
<tr>
<th *ngFor="let head of headElements" scope="col">{{head}} </th>
</tr>
</thead>
<tbody>
<tr mdbTableCol *ngFor="let el of elements">
<th scope="row">{{el.id}}</th>
<td>{{el.first}}</td>
<td>{{el.last}}</td>
<td>{{el.handle}}</td>
<td>{{el.first}}</td>
<td>{{el.last}}</td>
<td>{{el.handle}}</td>
<td>{{el.first}}</td>
<td>{{el.last}}</td>
</tr>
</tbody>
</table>
</div>
<!--/.Card content-->
</div>
<!--/.Card Front-->
<!-- Card reveal -->
<div class="card-reveal white">
<!-- Content -->
<span class="d-flex justify-content-between">
<span class="w-100 h-100 mx-2">
<h4 class="card-title font-weight-bold py-4">
Rectangular - Chart Issue !!!!
<mdb-icon fas icon="times" class="text-muted" (click)="card1.toggle()"></mdb-icon>
</h4>
<hr />
<div class="d-flex p-0 m-0">
<div class="flex-fill py-1 my-1">
<mdb-card>
<mdb-card-body>
<canvas
mdbChart
[chartType]="chartType"
[datasets]="chartDatasets"
[labels]="chartLabels"
[colors]="chartColors"
[options]="chartOptions"
[legend]="true"
(chartHover)="chartHovered($event)"
(chartClick)="chartClicked($event)"
>
</canvas>
</mdb-card-body>
</mdb-card>
</div></div></span
></span>
</div>
<!-- Card reveal -->
</mdb-card-reveal>
<mdb-card-reveal #card2>
<!-- Card front -->
<div class="card card-front">
<!--Card content-->
<div class="card-body mb-n2 p-1">
<span class="d-flex justify-content-between">
<h4 class="card-title">CARD 2</h4>
<a class="activator mr-2">
<mdb-icon fas icon="share-alt" (click)="card2.toggle()"></mdb-icon>
</a>
</span>
<table mdbTable>
<thead>
<tr>
<th *ngFor="let head of headElement2" scope="col">{{head}} </th>
</tr>
</thead>
<tbody>
<tr mdbTableCol *ngFor="let el of elements">
<th scope="row">{{el.id}}</th>
<td>{{el.first}}</td>
<td>{{el.last}}</td>
<td>{{el.handle}}</td>
</tr>
</tbody>
</table>
</div>
<!--/.Card content-->
</div>
<!--/.Card Front-->
<!-- Card reveal -->
<div class="card-reveal white">
<!-- Content -->
<span class="d-flex justify-content-between">
<span class="w-100 h-100 mx-2">
<h4 class="card-title font-weight-bold py-4">
More Square - Chart OK
<mdb-icon fas icon="times" class="text-muted" (click)="card2.toggle()"></mdb-icon>
</h4>
<hr />
<div class="d-flex p-0 m-0">
<div class="flex-fill py-1 my-1">
<mdb-card>
<mdb-card-body>
<canvas
mdbChart
[chartType]="chartType"
[datasets]="chartDatasets"
[labels]="chartLabels"
[colors]="chartColors"
[options]="chartOptions"
[legend]="true"
(chartHover)="chartHovered($event)"
(chartClick)="chartClicked($event)"
>
</canvas>
</mdb-card-body>
</mdb-card>
</div></div></span
></span>
</div>
<!-- Card reveal -->
</mdb-card-reveal>
</div>
</div>
Component Code
import { Component, OnInit } from '@angular/core';

@Component({
  selector: 'app-chartchardissue',
  templateUrl: './chartchardissue.component.html',
  styleUrls: ['./chartchardissue.component.scss']
})
export class ChartchardissueComponent implements OnInit {

  elements: any = [
    { id: 1, first: 'Mark', last: 'Otto', handle: '@mdo' },
    { id: 2, first: 'Jacob', last: 'Thornton', handle: '@fat' },
    { id: 3, first: 'Larry', last: 'the Bird', handle: '@twitter' },
    { id: 4, first: 'Larry', last: 'the Bird', handle: '@twitter' },
    { id: 5, first: 'Larry', last: 'the Bird', handle: '@twitter' }
  ];
  headElements = ['ID', 'First', 'Last', 'Handle', 'ID', 'First', 'Last', 'Handle', 'ID', 'First', 'Last'];
  headElement2 = ['ID', 'First', 'Last', 'Handle'];
  public chartType: string = 'line';
  public chartDatasets: Array<any> = [
    { data: [65, 59, 80, 81, 56, 55, 40], label: 'My First dataset' },
    { data: [28, 48, 40, 19, 86, 27, 90], label: 'My Second dataset' },
  ];
  public chartLabels: Array<any> = ['January', 'February', 'March', 'April', 'May', 'June', 'July'];
  public chartColors: Array<any> = [
    {
      backgroundColor: 'rgba(105, 0, 132, .2)',
      borderColor: 'rgba(200, 99, 132, .7)',
      borderWidth: 2,
    },
    {
      backgroundColor: 'rgba(0, 137, 132, .2)',
      borderColor: 'rgba(0, 10, 130, .7)',
      borderWidth: 2,
    },
  ];
  public chartOptions: any = {
    responsive: true,
  };
  public chartClicked(e: any): void {}
  public chartHovered(e: any): void {}
  constructor() { }

  ngOnInit() {
  }

}
Result in FireFox Browser (v 70.0)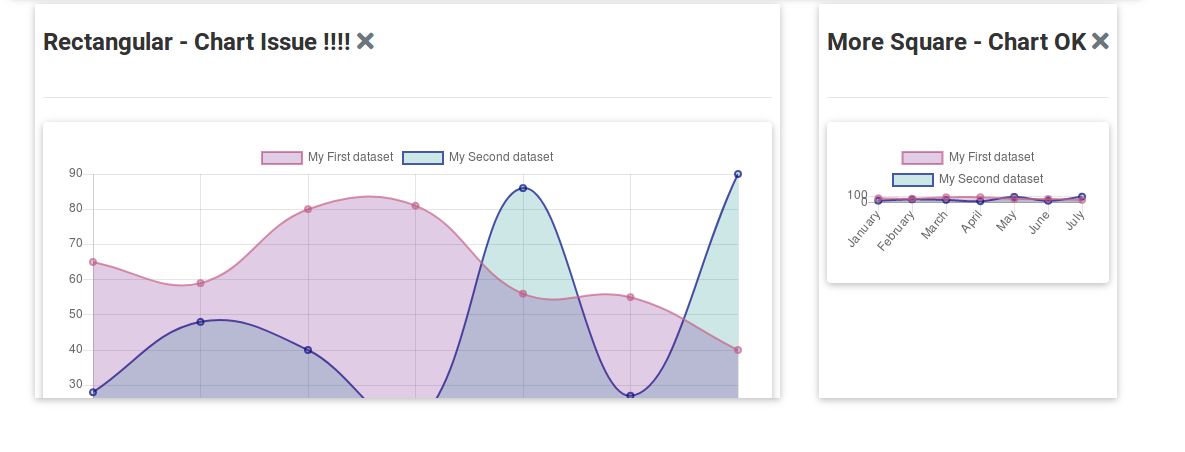
Result in Chrome (78.0.3904.70)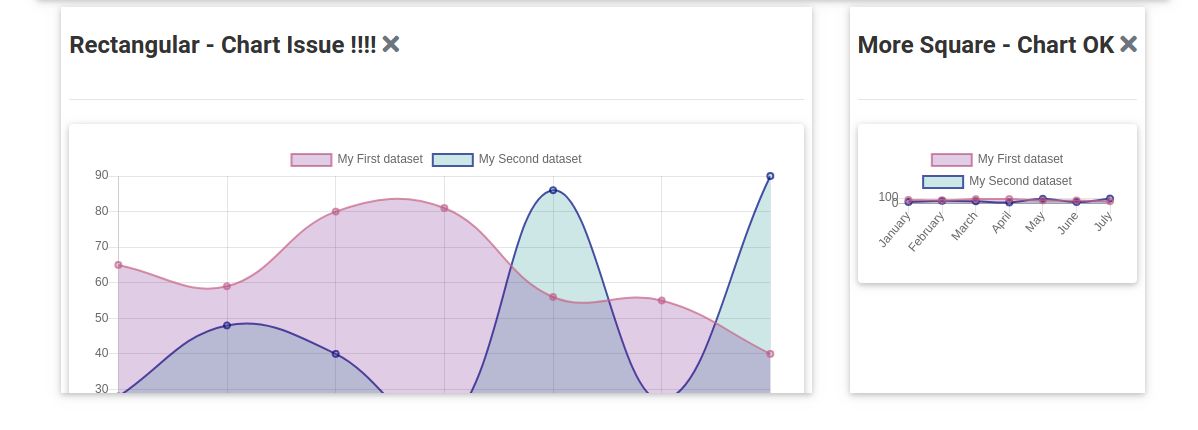
Dear @Jan Louw
Here is my full example based on your code :
HTML
<div class="d-flex flex-column">
<div class="d-flex justify-content-around">
<mdb-card-reveal #card1>
<!-- Card front -->
<div class="card card-front">
<!--Card image-->
<div class="view overlay waves-light" mdbWavesEffect>
<img
class="card-img-top"
src="https://mdbootstrap.com/img/Photos/Others/photo11.jpg"
alt="Card image cap"
/>
<a>
<div class="mask rgba-white-slight"></div>
</a>
</div>
<!--/.Card image-->
<!--Card content-->
<div class="card-body mb-n2 p-1">
<span class="d-flex justify-content-between">
<h4 class="card-title">QReplication - SMPD to Vodacom</h4>
<a class="activator mr-2">
<mdb-icon fas icon="share-alt" (click)="card1.toggle()"></mdb-icon>
</a>
</span>
<table mdbTable>
<thead>
<tr>
<th *ngFor="let head of headElements" scope="col">{{head}} </th>
</tr>
</thead>
<tbody>
<tr mdbTableCol *ngFor="let el of elements">
<th scope="row">{{el.id}}</th>
<td>{{el.first}}</td>
<td>{{el.last}}</td>
<td>{{el.handle}}</td>
</tr>
</tbody>
</table>
</div>
<!--/.Card content-->
</div>
<!--/.Card Front-->
<!-- Card reveal -->
<div class="card-reveal white">
<!-- Content -->
<span class="d-flex justify-content-between">
<span class="w-100 h-100 mx-2">
<h4 class="card-title font-weight-bold py-4">
Social shares
<mdb-icon fas icon="times" class="text-muted" (click)="card1.toggle()"></mdb-icon>
</h4>
<hr />
<div class="d-flex p-0 m-0">
<div class="flex-fill py-1 my-1">
<mdb-card>
<mdb-card-body>
<canvas
mdbChart
[chartType]="chartType"
[datasets]="chartDatasets"
[labels]="chartLabels"
[colors]="chartColors"
[options]="chartOptions"
[legend]="true"
(chartHover)="chartHovered($event)"
(chartClick)="chartClicked($event)"
>
</canvas>
</mdb-card-body>
</mdb-card>
</div></div></span
></span>
</div>
<!-- Card reveal -->
</mdb-card-reveal>
<mdb-card-reveal #card2>
<!-- Card front -->
<div class="card card-front">
<!--Card image-->
<div class="view overlay waves-light" mdbWavesEffect>
<img
class="card-img-top"
src="https://mdbootstrap.com/img/Photos/Others/photo11.jpg"
alt="Card image cap"
/>
<a>
<div class="mask rgba-white-slight"></div>
</a>
</div>
<!--/.Card image-->
<!--Card content-->
<div class="card-body mb-n2 p-1">
<span class="d-flex justify-content-between">
<h4 class="card-title">QReplication - SMPD to Vodacom</h4>
<a class="activator mr-2">
<mdb-icon fas icon="share-alt" (click)="card2.toggle()"></mdb-icon>
</a>
</span>
<table mdbTable>
<thead>
<tr>
<th *ngFor="let head of headElements" scope="col">{{head}} </th>
</tr>
</thead>
<tbody>
<tr mdbTableCol *ngFor="let el of elements">
<th scope="row">{{el.id}}</th>
<td>{{el.first}}</td>
<td>{{el.last}}</td>
<td>{{el.handle}}</td>
</tr>
</tbody>
</table>
</div>
<!--/.Card content-->
</div>
<!--/.Card Front-->
<!-- Card reveal -->
<div class="card-reveal white">
<!-- Content -->
<span class="d-flex justify-content-between">
<span class="w-100 h-100 mx-2">
<h4 class="card-title font-weight-bold py-4">
Social shares
<mdb-icon fas icon="times" class="text-muted" (click)="card2.toggle()"></mdb-icon>
</h4>
<hr />
<div class="d-flex p-0 m-0">
<div class="flex-fill py-1 my-1">
<mdb-card>
<mdb-card-body>
<canvas
mdbChart
[chartType]="chartType"
[datasets]="chartDatasets"
[labels]="chartLabels"
[colors]="chartColors"
[options]="chartOptions"
[legend]="true"
(chartHover)="chartHovered($event)"
(chartClick)="chartClicked($event)"
>
</canvas>
</mdb-card-body>
</mdb-card>
</div></div></span
></span>
</div>
<!-- Card reveal -->
</mdb-card-reveal>
</div>
</div>
TS
 elements: any = [
    { id: 1, first: 'Mark', last: 'Otto', handle: '@mdo' },
    { id: 2, first: 'Jacob', last: 'Thornton', handle: '@fat' },
    { id: 3, first: 'Larry', last: 'the Bird', handle: '@twitter' },
  ];
  headElements = ['ID', 'First', 'Last', 'Handle'];
  public chartType: string = 'line';
  public chartDatasets: Array<any> = [
    { data: [65, 59, 80, 81, 56, 55, 40], label: 'My First dataset' },
    { data: [28, 48, 40, 19, 86, 27, 90], label: 'My Second dataset' },
  ];
  public chartLabels: Array<any> = ['January', 'February', 'March', 'April', 'May', 'June', 'July'];
  public chartColors: Array<any> = [
    {
      backgroundColor: 'rgba(105, 0, 132, .2)',
      borderColor: 'rgba(200, 99, 132, .7)',
      borderWidth: 2,
    },
    {
      backgroundColor: 'rgba(0, 137, 132, .2)',
      borderColor: 'rgba(0, 10, 130, .7)',
      borderWidth: 2,
    },
  ];
  public chartOptions: any = {
    responsive: true,
  };
  public chartClicked(e: any): void {}
  public chartHovered(e: any): void {}
Everything looks fine. Don't you have your custom styles (that could overwrite cards)?
Best Regards, Bartosz.
Jan Louw pro commented 6 years ago
Hi Bartosz,
Your second solution includes an image part of the card, causing the cards to be a square shape, which then fits the backend reveal chart. My issue is when the card is a more rectangular shape, causing the chart not to display correctly.
Is there a way to fix the card size to be always square, to see if this will show the chart correctly?
Regards
Bartosz Termena staff commented 6 years ago
Dear @Jan Louw
Please use my code to add your rectangular shapes, so that I can reproduce your problem.
Best Regards, Bartosz.
Jan Louw pro commented 6 years ago
Dear Bartosz
I've published sample code based on your code - I removed the card images, though.
Regards
Dear @Jan Louw
I can not reproduce your problem, Are you using Card Reveal from https://mdbootstrap.com/plugins/angular/flipping-cards/#card-reveal ?
Below is my example with Line Chart inside Card Reveal:
HTML
<div class="container">
  <div class="row">
    <div class="col-md-6">
      <mdb-card-reveal #cards>
        <!-- Card front -->
        <div class="card card-front">
          <!--Card image-->
          <div class="view overlay waves-light" mdbWavesEffect>
            <img
              class="card-img-top"
              src="https://mdbootstrap.com/img/Photos/Others/photo11.jpg"
              alt="Card image cap"
            />
            <a>
              <div class="mask rgba-white-slight"></div>
            </a>
          </div>
          <!--/.Card image-->
          <!--Card content-->
          <div class="card-body">
            <!--Social shares button-->
            <a class="activator mr-2">
              <mdb-icon fas icon="share-alt" (click)="cards.toggle()"></mdb-icon>
            </a>
            <!--Title-->
            <h4 class="card-title">Card title</h4>
            <hr />
            <!--Text-->
            <p class="card-text">
              Some quick example text to build on the card title and make up the bulk of the card's
              content.
            </p>
            <a class="link-text">
              <h5 class="waves-light" mdbWavesEffect>
                Read more
                <mdb-icon fas icon="chevron-right" class="waves-light" mdbWavesEffect></mdb-icon>
              </h5>
            </a>
          </div>
          <!--/.Card content-->
        </div>
        <!--/.Card Front-->

        <!-- Card reveal -->
        <div class="card-reveal white">
          <!-- Content -->
          <div class="content text-center">
            <h4 class="card-title font-weight-bold py-4">
              Social shares
              <mdb-icon fas icon="times" class="text-muted" (click)="cards.toggle()"></mdb-icon>
            </h4>
            <hr />
            <div style="display: block">
              <canvas
                mdbChart
                [chartType]="chartType"
                [datasets]="chartDatasets"
                [labels]="chartLabels"
                [colors]="chartColors"
                [options]="chartOptions"
                [legend]="true"
                (chartHover)="chartHovered($event)"
                (chartClick)="chartClicked($event)"
              >
              </canvas>
            </div>
          </div>
        </div>
        <!-- Card reveal -->
      </mdb-card-reveal>
    </div>
  </div>
</div>
TS
 public chartType: string = 'line';

  public chartDatasets: Array<any> = [
    { data: [65, 59, 80, 81, 56, 55, 40], label: 'My First dataset' },
    { data: [28, 48, 40, 19, 86, 27, 90], label: 'My Second dataset' },
  ];

  public chartLabels: Array<any> = ['January', 'February', 'March', 'April', 'May', 'June', 'July'];

  public chartColors: Array<any> = [
    {
      backgroundColor: 'rgba(105, 0, 132, .2)',
      borderColor: 'rgba(200, 99, 132, .7)',
      borderWidth: 2,
    },
    {
      backgroundColor: 'rgba(0, 137, 132, .2)',
      borderColor: 'rgba(0, 10, 130, .7)',
      borderWidth: 2,
    },
  ];

  public chartOptions: any = {
    responsive: true,
  };
  public chartClicked(e: any): void {}
  public chartHovered(e: any): void {}
I am waiting for your reply with more information.
Best Regards, Bartosz.
Jan Louw pro commented 6 years ago
Hi Bartosz,
I've added my code to my question. I'm using Flexbox to position 2 flipping cards horizontal, and not sure if this is causing the issue.
I appreciate your input.
Regards
Closed
This topic is closed.
FREE CONSULTATION
Hire our experts to build a dedicated project. We'll analyze your business requirements, for free.
Closed
- ForumUser: Pro
- Premium support: No
- Technology: MDB Angular
- MDB Version: 8.5.0
- Device: Na
- Browser: Na
- OS: Na
- Provided sample code: No
- Provided link: No