Topic: Connecting charts to datatables

Hi, I'd like to synchronize charts and datatables filled from sql queries.
My html code contains php script, similar to this one below, and the chart is "typical", based on tutorials.How could I replace myLineChart .data.labels with timestamps, and myLineChart .data.datasets.data with values?
<?php
  $result = pg_query($sql) or die( pg_last_error() );
  $rows = pg_num_rows($result);
  echo '<table id="dtUnits" ... >';
  echo '<thead>';
  ...
  echo '</thead>';
  echo '<tbody>';
    $dataTemperature = array();
    while($row=pg_fetch_assoc($result)){
      echo '<tr '.$class.'>';
        echo "<td>".$row['cd_timestamp']."</td>";
        echo '<td>'.$row["cd_value"].'</td>';
        ...
                array_push(
                  $dataTemperature, array(
                    "label"=> $row['cd_timestamp'],
                    "value"=> $row["cd_value"]
                  )
                );

        ...
      echo '</tr >';
    }
    //$text = print_r($dataTemperature, true);
    //echo "<script type='text/javascript'> alert('".json_encode($text)."') </script>";
   echo '</tbody>';
  echo '</table>';
?>

 var ctxL = document.getElementById("lineChart").getContext('2d');
 var myLineChart = new Chart(ctxL, {
   type: 'line',
   data: {
      labels: ["January", "February", "March", "April", "May", "June", "July"],
     datasets: [{
       label: "Label",
       fillColor: "#fff",
       backgroundColor: 'rgba(255, 255, 255, .3)',
       borderColor: 'rgba(255, 255, 255)',
      data: [0, 10, 5, 2, 20, 30, 45],
   }]
 },
 etc.
Hi Aliaksandr,
thanks for advice, you helped a lot.
Of course this skeleton requires some fine tuning, but it seems to be a good starting point.
Best regards,
István

Hi,
You can try the next approach:
1) Create a function which will generate new Chart after data changes:
   const createChart = ({ type, data, options }) => {
        return new Chart(ctx, { type, data, options });
   };
2) Save Chart parameters in variables, f.e. :
      let type = 'bar';
      let label = '# of Votes';
      let labels = ['Red', 'Blue', 'Yellow', 'Green', 'Purple', 'Orange'];
      let datasetData = [12, 19, 3, 5, 2, 3];
      let backgroundColor = [
        'rgba(255, 99, 132, 0.2)',
        'rgba(54, 162, 235, 0.2)',
        'rgba(255, 206, 86, 0.2)',
        'rgba(75, 192, 192, 0.2)',
        'rgba(153, 102, 255, 0.2)',
        'rgba(255, 159, 64, 0.2)'
      ];
      let borderColor = [
        'rgba(255,99,132,1)',
        'rgba(54, 162, 235, 1)',
        'rgba(255, 206, 86, 1)',
        'rgba(75, 192, 192, 1)',
        'rgba(153, 102, 255, 1)',
        'rgba(255, 159, 64, 1)'
      ];
      let borderWidth = 1;

      let datasets = [
        {
          label,
          data: datasetData,
          backgroundColor,
          borderColor,
          borderWidth
        }
      ];

      let data = {
        labels,
        datasets
      };

      let options = {
        scales: {
          yAxes: [
            {
              ticks: {
                beginAtZero: true
              }
            }
          ]
        }
      };
3) After data is loaded from a database, you can process this data and pass it to the function which creates a new Chart:
 {
            newLabels = [...]; //Data from database
            data.labels = newLabels;

            myChart = createChart({ type, data, options });
}
The same can be used with Datatables.
Hope it will help.
Best regards.
Hello Adam,
This is the query (limited by practical aspects):
$sql = 'SELECT * FROM compr_data, mb_regs WHERE cd_register=mbr_register ORDER BY cd_recorded DESC, cd_register LIMIT 2';
$result = pg_query($sql) or die(pg_last_error());
$row=pg_fetch_assoc($result);
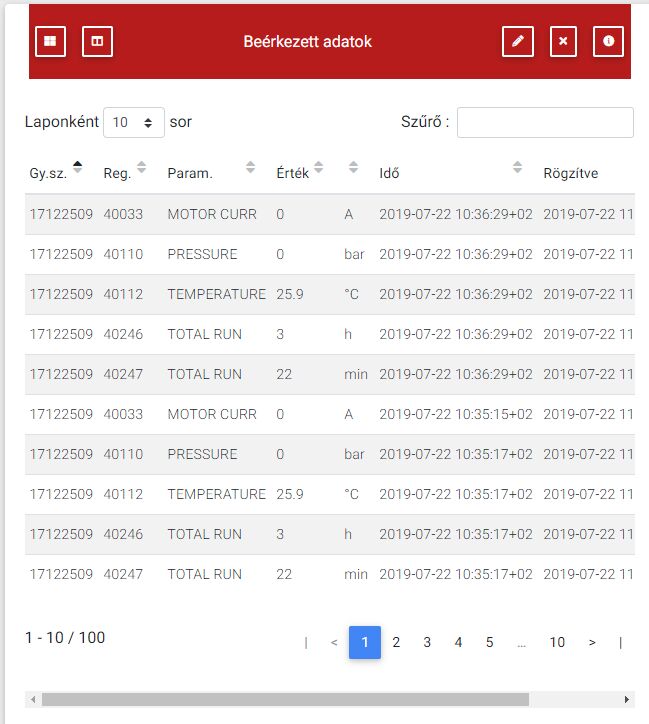
Please find below var_dump($row) and a screen-shot of the resulted table:
array(16) { ["cd_azon"]=> string(5) "11378" ["cd_serial"]=> string(8) "17122509" ["cd_register"]=> string(5) "40033" ["cd_timestamp"]=> string(22) "2019-07-22 10:36:29+02" ["cd_value"]=> string(1) "0" ["cd_qualifier"]=> NULL ["cd_ts_str"]=> string(8) "5b545e2d" ["cd_recorded"]=> string(22) "2019-07-22 11:42:32+02" ["cd_seqno"]=> string(3) "240" ["mbr_azon"]=> string(1) "1" ["mbr_register"]=> string(5) "40033" ["mbr_tag"]=> string(10) "MOTOR CURR" ["mbr_desc"]=> string(44) "Display the output current of motor inverter" ["mbr_def_hex"]=> NULL ["mbr_format"]=> string(5) "000.0" ["mbr_unit"]=> string(1) "A" } array(16) { ["cd_azon"]=> string(5) "11376" ["cd_serial"]=> string(8) "17122509" ["cd_register"]=> string(5) "40110" ["cd_timestamp"]=> string(22) "2019-07-22 10:36:29+02" ["cd_value"]=> string(1) "0" ["cd_qualifier"]=> NULL ["cd_ts_str"]=> string(8) "5b545e2d" ["cd_recorded"]=> string(22) "2019-07-22 11:42:32+02" ["cd_seqno"]=> string(3) "240" ["mbr_azon"]=> string(1) "2" ["mbr_register"]=> string(5) "40110" ["mbr_tag"]=> string(8) "PRESSURE" ["mbr_desc"]=> NULL ["mbr_def_hex"]=> NULL ["mbr_format"]=> string(5) "00.00" ["mbr_unit"]=> string(3) "bar" }
This is the dump of temporary array, created in the while loop of tbody:
$text = print_r($dataTemperature, true);
var_dump($text);

string(2260) "Array ( [0] => Array ( [label] => 2019-07-22 10:36:29+02 [value] => 25.9 ) [1] => Array ( [label] => 2019-07-22 10:35:17+02 [value] => 25.9 ) [2] => Array ( [label] => 2019-07-22 10:04:57+02 [value] => 25.8 ) [3] => Array ( [label] => 2019-07-22 09:54:49+02 [value] => 25.7 ) [4] => Array ( [label] => 2019-07-22 09:34:35+02 [value] => 25.8 ) [5] => Array ( [label] => 2019-07-22 09:14:25+02 [value] => 25.8 ) [6] => Array ( [label] => 2019-07-22 08:54:12+02 [value] => 25.8 ) [7] => Array ( [label] => 2019-07-22 08:33:59+02 [value] => 25.8 ) [8] => Array ( [label] => 2019-07-22 08:23:53+02 [value] => 26.1 ) [9] => Array ( [label] => 2019-07-22 08:13:45+02 [value] => 26.1 ) [10] => Array ( [label] => 2019-07-22 08:03:39+02 [value] => 25.8 ) [11] => Array ( [label] => 2019-07-22 07:53:33+02 [value] => 25.9 ) [12] => Array ( [label] => 2019-07-22 07:12:41+02 [value] => 25.9 ) [13] => Array ( [label] => 2019-07-22 07:02:45+02 [value] => 25.9 ) [14] => Array ( [label] => 2019-07-22 06:42:54+02 [value] => 25.8 ) [15] => Array ( [label] => 2019-07-22 06:23:02+02 [value] => 25.9 ) [16] => Array ( [label] => 2019-07-22 05:53:18+02 [value] => 26.1 ) [17] => Array ( [label] => 2019-07-22 05:33:27+02 [value] => 25.7 ) [18] => Array ( [label] => 2019-07-22 05:23:30+02 [value] => 25.9 ) [19] => Array ( [label] => 2019-07-22 05:13:34+02 [value] => 25.8 ) ) "
Regards,István

FREE CONSULTATION
Hire our experts to build a dedicated project. We'll analyze your business requirements, for free.
Answered
- ForumUser: Free
- Premium support: No
- Technology: MDB jQuery
- MDB Version: 4.8.5
- Device: PC
- Browser: Chrome
- OS: Windows 7
- Provided sample code: No
- Provided link: No