Topic: How to make a single chart popout?

Hi,
I used this Chart component below:
https://re-admin-pro.mdbootstrap.com/charts
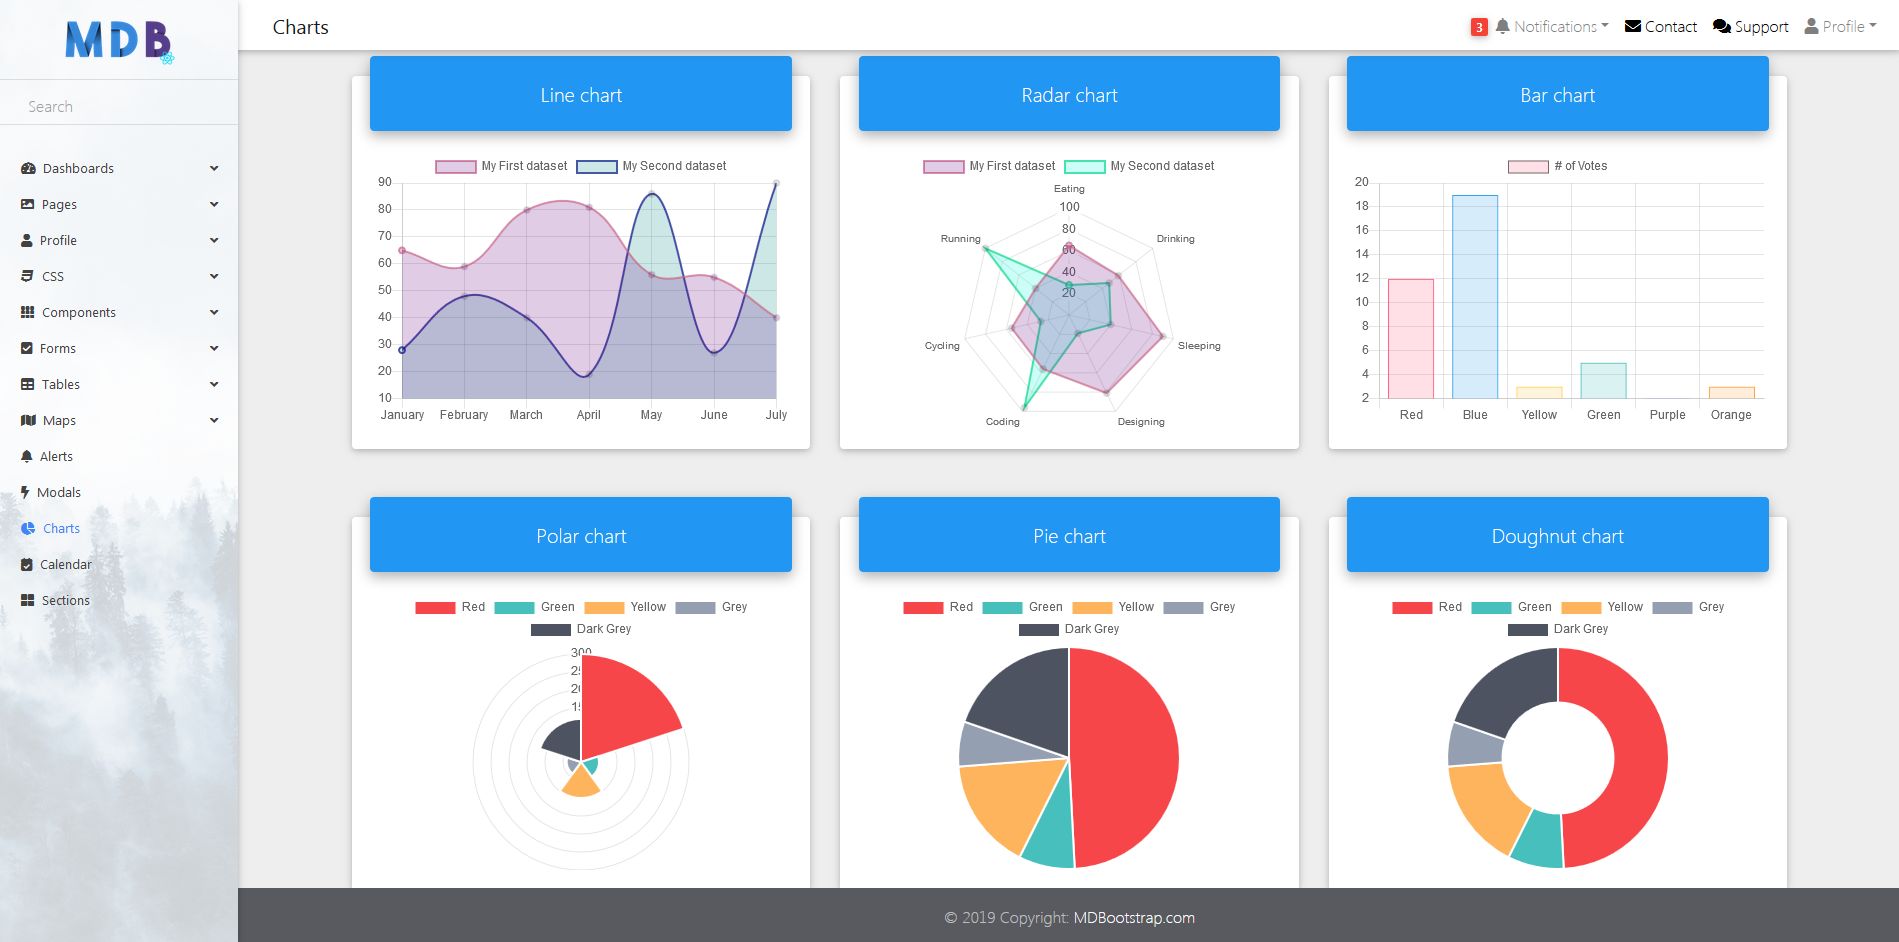
How to make say; the Line Chart below when I click it, it will show like a lightbox (full screen) or modal with a bigger screen size so I could see it in more clearly in single display? Kindly please advise how to code it and achieve that? Thank you very much.
Hi Konrad,
Here it is the screenshot. When I clicked the Doughnut Chart, it look like this. It didn't show anything just blank white screen. Thank you for your attention.
cokicoki free commented 6 years ago
If it is possible, could you guide / show me the snippet for the real world example at the LineChart component above. That is the real charts that I want to enlarge with modal for clarity. As for the minimalistic chart, I don't need to popout them as it is already clear enough to see.
So if it is successful (the snippet), I could be able to duplicate it for the rest of other charts components for production (BarChart, DoughnutChart, PieChart, PolarChart, RadarChart). Thank you Konrad for your kind assistance.
Konrad Stępień staff commented 6 years ago
Hi @cokicoki,
If you can please try to download my project from GitHub.
Maybe you can find the solution in my project.
Best, Konrad.
cokicoki free commented 6 years ago
Hi Konrad,
Yes. Thank you so much for the solution and code snippet given.I will try and learn it. I will be back again. Thanks again.
Konrad Stępień staff commented 6 years ago
I waiting for your answer :)
Good luck!
Hi Konrad,
Yes, it works but when I clicked the doughnut chart, it display nothing. The screen is blank, it doesn't display anything.
What went wrong sir? please advised. Thank you.
Here the code:
ChartsPaje.js
import React from 'react';
import {
  MDBContainer,
  MDBRow,
  MDBCol,
  MDBCard,
  MDBCardBody,
  MDBSimpleChart,
  MDBView,
  MDBModal
} from 'mdbreact';

import LineChart from "./LineChart";
import BarChart from "./BarChart";
import DoughnutChart from "./DoughnutChart";
import PieChart from "./PieChart";
import PolarChart from "./PolarChart";
import RadarChart from "./RadarChart";

class ChartsPage extends React.Component {
  state = {
    modal: false
  };
  toggle = () => {
    this.setState({
      modal: !this.state.modal
    });
  };

  render() {
    return (
      <MDBContainer>
        <div id='charts'>
          <section>
            <MDBRow className='mb-4'>
              <MDBCol md='12' lg='4' className='mb-4'>
                <LineChart/>
              </MDBCol>
              <MDBCol md='12' lg='4' className='mb-4'>
                <RadarChart/>
              </MDBCol>
              <MDBCol md='12' lg='4' className='mb-4'>
                <BarChart/>
              </MDBCol>
            </MDBRow>
            <MDBRow className='mb-4'>
              <MDBCol md='12' lg='4' className='mb-4'>
                <PolarChart/>
              </MDBCol>
              <MDBCol md='12' lg='4' className='mb-4'>
                <PieChart/>
              </MDBCol>
              <MDBCol md='12' lg='4' className='mb-4'>
                <DoughnutChart/>
              </MDBCol>
            </MDBRow>
            <MDBRow className='mb-3'>
              <MDBCol md='12' lg='4' className='mb-4'>
                <MDBCard narrow>
                  <MDBView cascade className='gradient-card-header blue'>
                    <h5 className='mb-0'>Polar chart</h5>
                  </MDBView>
                  <MDBCardBody className='text-center py-5'>
                    <MDBSimpleChart
                      strokeColor='green'
                      strokeWidth={3}
                      width={100}
                      height={100}
                      percent={56}
                      labelFontWeight='normal'
                    />
                  </MDBCardBody>
                </MDBCard>
              </MDBCol>
              <MDBCol md='12' lg='4' className='mb-4'>
                <MDBCard narrow>
                  <MDBView cascade className='gradient-card-header blue'>
                    <h5 className='mb-0'>Pie chart</h5>
                  </MDBView>
                  <MDBCardBody className='text-center py-5'>
                    <MDBSimpleChart
                      strokeColor='red'
                      strokeWidth={3}
                      width={100}
                      height={100}
                      percent={76}
                      labelFontWeight='normal'
                    />
                  </MDBCardBody>
                </MDBCard>
              </MDBCol>
              <MDBCol md="12" lg="4" className="mb-4">
                <MDBCard narrow>
                  <MDBView cascade className="gradient-card-header blue">
                    <h5 className="mb-0">Doughnut chart</h5>
                  </MDBView>
                  <MDBCardBody
                    className="text-center py-5"
                    onClick={() => {
                      console.log("click");
                      this.toggle();
                    }}
                    style={{ cursor: "pointer" }}
                  >
                    <MDBSimpleChart
                      strokeColor="grey"
                      strokeWidth={3}
                      width={100}
                      height={100}
                      percent={100}
                      labelFontWeight="normal"
                    />
                    <MDBModal
                      isOpen={this.state.modal}
                      toggle={()=>this.toggle()}
                      fullHeight
                      position="top"
                    >
                      <MDBSimpleChart
                        strokeColor="grey"
                        strokeWidth={3}
                        width={100}
                        height={100}
                        percent={100}
                        labelFontWeight="normal"
                      />
                    </MDBModal>
                  </MDBCardBody>
                </MDBCard>
              </MDBCol>
            </MDBRow>
          </section>
        </div>
      </MDBContainer>
    );
  }
};

export default ChartsPage;
Konrad Stępień staff commented 6 years ago
Hi @cokicoki,
This is my code (I did copy your code and use // to remove unused imports. And fix onClick method)
import React from "react";
import {
  MDBContainer,
  MDBRow,
  MDBCol,
  MDBCard,
  MDBCardBody,
  MDBSimpleChart,
  MDBView,
  MDBModal
} from "mdbreact";

import LineChart from "./LineChart";
// import BarChart from "./BarChart";
// import DoughnutChart from "./DoughnutChart";
// import PieChart from "./PieChart";
// import PolarChart from "./PolarChart";
// import RadarChart from "./RadarChart";

class ChartsPage extends React.Component {
  state = {
    modal: false
  };
  toggle = () => {
    this.setState({
      modal: !this.state.modal
    });
  };

  render() {
    return (
      <MDBContainer>
        <div id="charts">
          <section>
            <MDBRow className="mb-4">
              <MDBCol md="12" lg="4" className="mb-4">
                <LineChart />
              </MDBCol>
              {/* <MDBCol md='12' lg='4' className='mb-4'>
                <RadarChart/>
              </MDBCol>
              <MDBCol md='12' lg='4' className='mb-4'>
                <BarChart/>
              </MDBCol>
            </MDBRow>
            <MDBRow className='mb-4'>
              <MDBCol md='12' lg='4' className='mb-4'>
                <PolarChart/>
              </MDBCol>
              <MDBCol md='12' lg='4' className='mb-4'>
                <PieChart/>
              </MDBCol>
              <MDBCol md='12' lg='4' className='mb-4'>
                <DoughnutChart/>
              </MDBCol> */}
            </MDBRow>
            <MDBRow className="mb-3">
              <MDBCol md="12" lg="4" className="mb-4">
                <MDBCard narrow>
                  <MDBView cascade className="gradient-card-header blue">
                    <h5 className="mb-0">Polar chart</h5>
                  </MDBView>
                  <MDBCardBody className="text-center py-5">
                    <MDBSimpleChart
                      strokeColor="green"
                      strokeWidth={3}
                      width={100}
                      height={100}
                      percent={56}
                      labelFontWeight="normal"
                    />
                  </MDBCardBody>
                </MDBCard>
              </MDBCol>
              <MDBCol md="12" lg="4" className="mb-4">
                <MDBCard narrow>
                  <MDBView cascade className="gradient-card-header blue">
                    <h5 className="mb-0">Pie chart</h5>
                  </MDBView>
                  <MDBCardBody className="text-center py-5">
                    <MDBSimpleChart
                      strokeColor="red"
                      strokeWidth={3}
                      width={100}
                      height={100}
                      percent={76}
                      labelFontWeight="normal"
                    />
                  </MDBCardBody>
                </MDBCard>
              </MDBCol>
              <MDBCol md="12" lg="4" className="mb-4">
                <MDBCard narrow>
                  <MDBView cascade className="gradient-card-header blue">
                    <h5 className="mb-0">Doughnut chart</h5>
                  </MDBView>
                  <MDBCardBody
                    className="text-center py-5"
                    onClick={() => {
                      console.log("click");
                      this.toggle();
                    }}
                    style={{ cursor: "pointer" }}
                  >
                    <MDBSimpleChart
                      strokeColor="grey"
                      strokeWidth={3}
                      width={100}
                      height={100}
                      percent={100}
                      labelFontWeight="normal"
                    />
                  </MDBCardBody>
                  <MDBModal
                    isOpen={this.state.modal}
                    toggle={() => this.toggle()}
                    fullHeight
                    position="top"
                  >
                    <MDBSimpleChart
                      strokeColor="grey"
                      strokeWidth={3}
                      width={100}
                      height={100}
                      percent={100}
                      labelFontWeight="normal"
                    />
                  </MDBModal>
                </MDBCard>
              </MDBCol>
            </MDBRow>
          </section>
        </div>
      </MDBContainer>
    );
  }
}

export default ChartsPage;
And if I click in the red area:
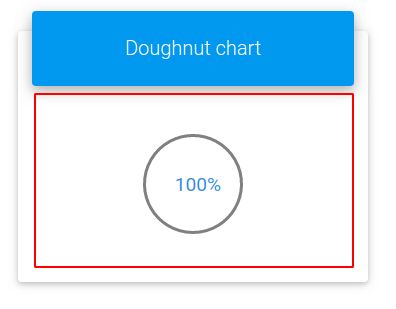
the modal is open like this:
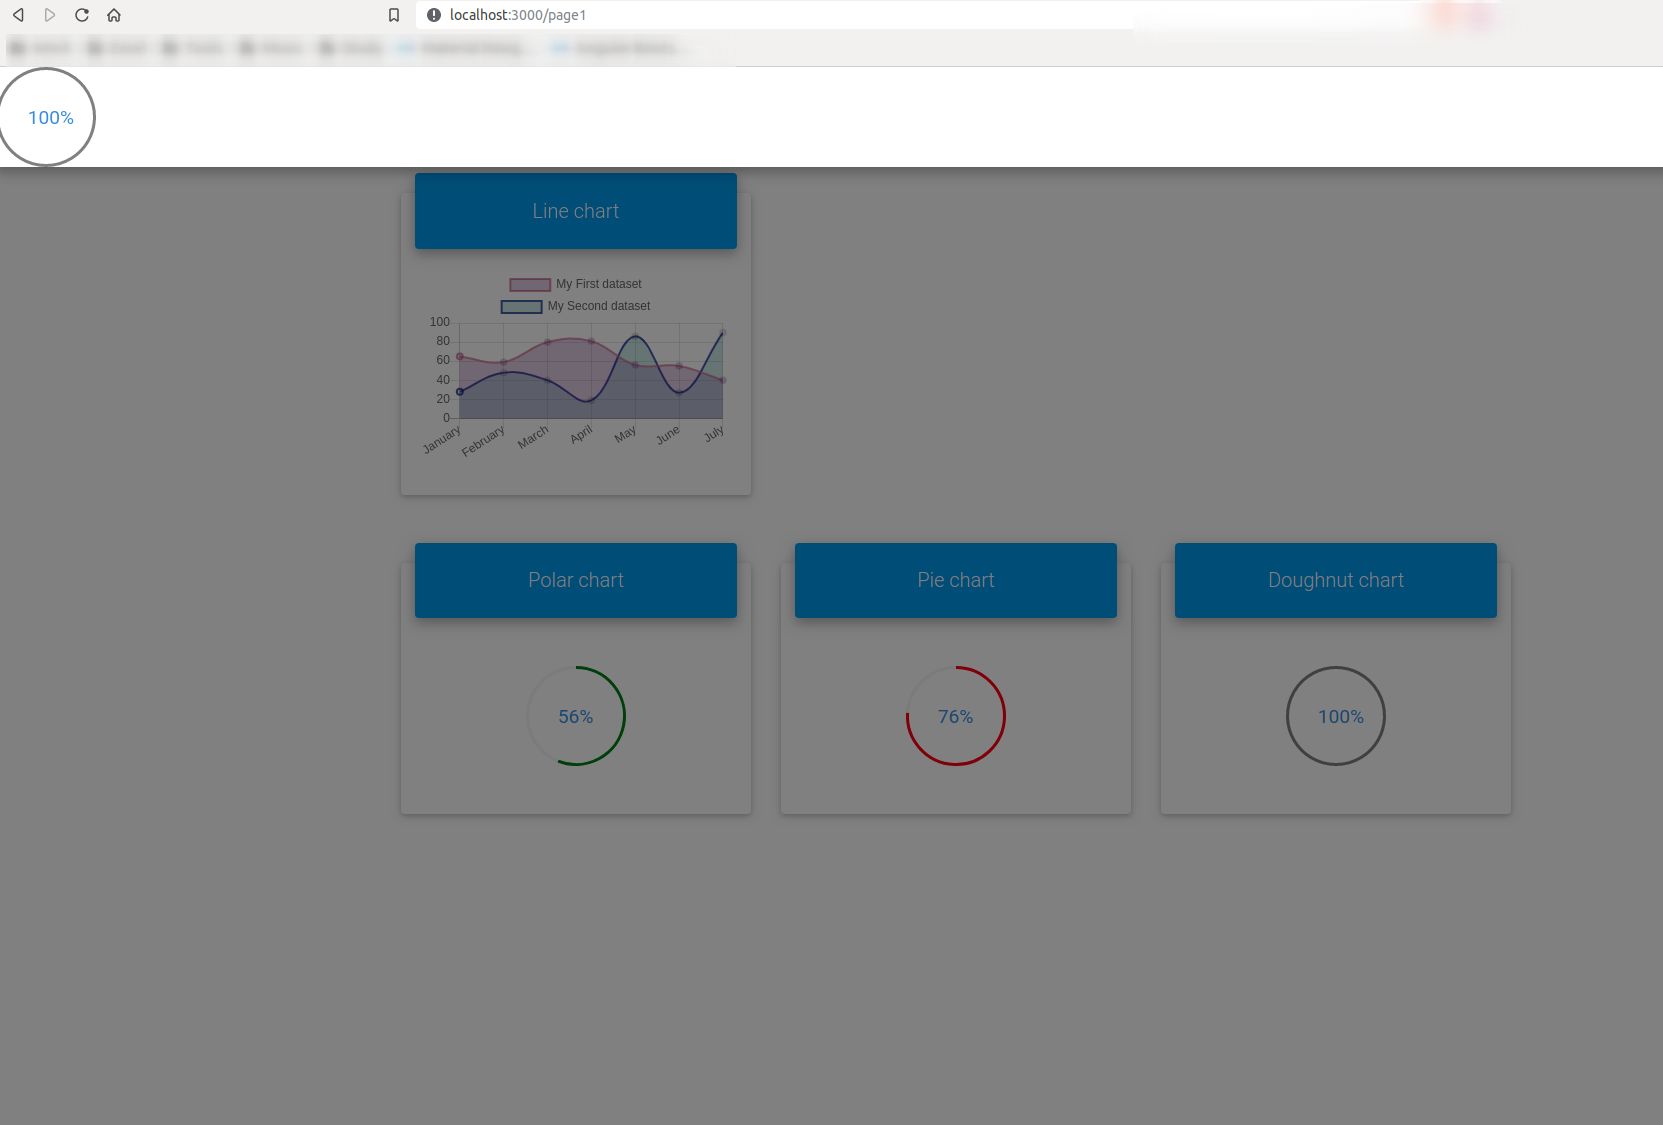
It doesn't look like "fullscreen" yet, so I said you must use your own styles to enlarge the modal.
Can you send me your screenshot?
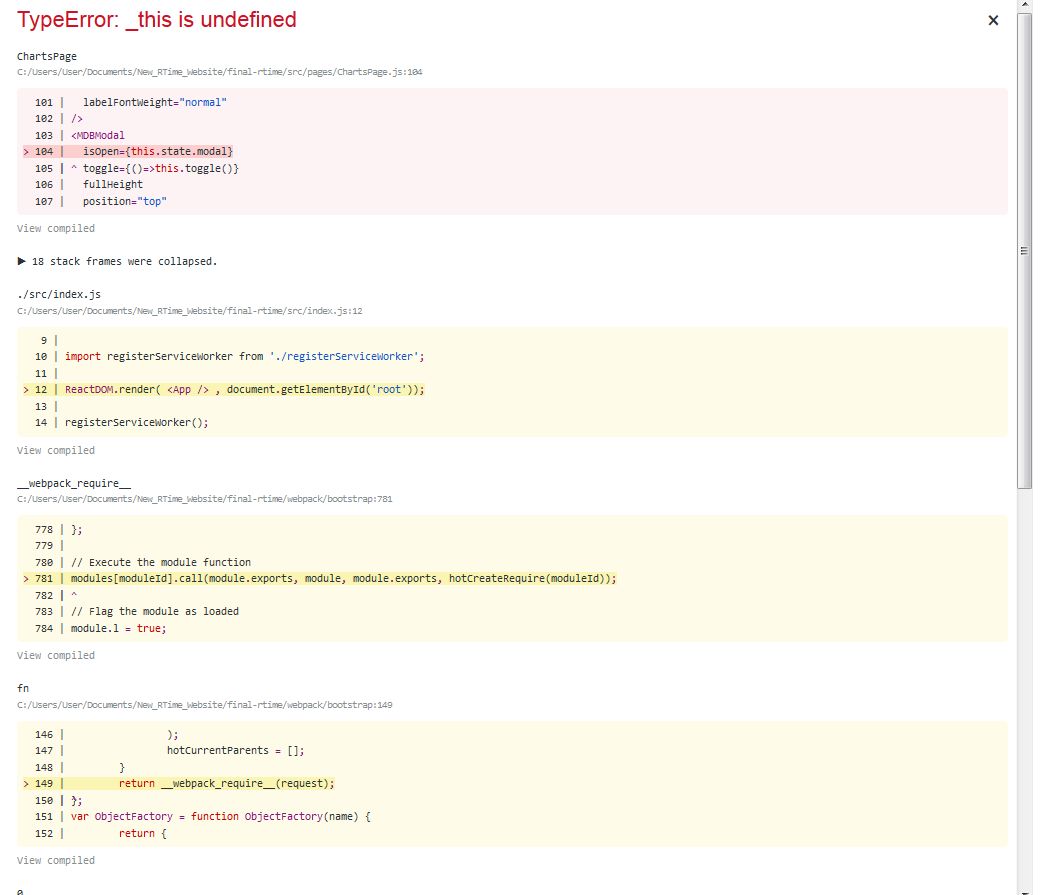
Hi Konrad,
I have tried and It didn't work. It said like this:
What went wrong sir? please advised! Thank you.
And this the code: ChartsPage.js
import React from 'react';
import {
  MDBContainer,
  MDBRow,
  MDBCol,
  MDBCard,
  MDBCardBody,
  MDBSimpleChart,
  MDBView,
  MDBModal
} from 'mdbreact';

import LineChart from "./LineChart";
import BarChart from "./BarChart";
import DoughnutChart from "./DoughnutChart";
import PieChart from "./PieChart";
import PolarChart from "./PolarChart";
import RadarChart from "./RadarChart";

    const ChartsPage = () => {
      return (
        <MDBContainer>
          <div id='charts'>
            <section>
              <MDBRow className='mb-4'>
                <MDBCol md='12' lg='4' className='mb-4'>
                  <LineChart/>
                </MDBCol>
                <MDBCol md='12' lg='4' className='mb-4'>
                  <RadarChart/>
                </MDBCol>
                <MDBCol md='12' lg='4' className='mb-4'>
                  <BarChart/>
                </MDBCol>
              </MDBRow>
              <MDBRow className='mb-4'>
                <MDBCol md='12' lg='4' className='mb-4'>
                  <PolarChart/>
                </MDBCol>
                <MDBCol md='12' lg='4' className='mb-4'>
                  <PieChart/>
                </MDBCol>
                <MDBCol md='12' lg='4' className='mb-4'>
                  <DoughnutChart/>
                </MDBCol>
              </MDBRow>
              <MDBRow className='mb-3'>
                <MDBCol md='12' lg='4' className='mb-4'>
                  <MDBCard narrow>
                    <MDBView cascade className='gradient-card-header blue'>
                      <h5 className='mb-0'>Polar chart</h5>
                    </MDBView>
                    <MDBCardBody className='text-center py-5'>
                      <MDBSimpleChart
                        strokeColor='green'
                        strokeWidth={3}
                        width={100}
                        height={100}
                        percent={56}
                        labelFontWeight='normal'
                      />
                    </MDBCardBody>
                  </MDBCard>
                </MDBCol>
                <MDBCol md='12' lg='4' className='mb-4'>
                  <MDBCard narrow>
                    <MDBView cascade className='gradient-card-header blue'>
                      <h5 className='mb-0'>Pie chart</h5>
                    </MDBView>
                    <MDBCardBody className='text-center py-5'>
                      <MDBSimpleChart
                        strokeColor='red'
                        strokeWidth={3}
                        width={100}
                        height={100}
                        percent={76}
                        labelFontWeight='normal'
                      />
                    </MDBCardBody>
                  </MDBCard>
                </MDBCol>
                <MDBCol md="12" lg="4" className="mb-4">
                  <MDBCard narrow>
                    <MDBView cascade className="gradient-card-header blue">
                      <h5 className="mb-0">Doughnut chart</h5>
                    </MDBView>
                    <MDBCardBody
                      className="text-center py-5"
                      onClick={() => {
                        console.log("click");
                        this.toggle();
                      }}
                      style={{ cursor: "pointer" }}
                    >
                      <MDBSimpleChart
                        strokeColor="grey"
                        strokeWidth={3}
                        width={100}
                        height={100}
                        percent={100}
                        labelFontWeight="normal"
                      />
                      <MDBModal
                        isOpen={this.state.modal}
                        toggle={()=>this.toggle()}
                        fullHeight
                        position="top"
                      >
                        <MDBSimpleChart
                          strokeColor="grey"
                          strokeWidth={3}
                          width={100}
                          height={100}
                          percent={100}
                          labelFontWeight="normal"
                        />
                      </MDBModal>
                    </MDBCardBody>
                  </MDBCard>
                </MDBCol>
              </MDBRow>
            </section>
          </div>
        </MDBContainer>
      );
    };

    export default ChartsPage;
Hi Konrad,
I attach my components here, would you please advise how to integrate this to achieve the desire result that I mention above. For example, when someone click my LineChart at the ChartPage, the LineChart will popout to a bigger screen (single fullscreen/ or like lightbox) so everybody can see clearly the chart details. Kindly please show and guide me with this code/components? Thank you so much.
This is my ChartPage.js;
import React from 'react';
import {
  MDBContainer,
  MDBRow,
  MDBCol,
  MDBCard,
  MDBCardBody,
  MDBSimpleChart,
  MDBView
} from 'mdbreact';

import LineChart from "./LineChart";
import BarChart from "./BarChart";
import DoughnutChart from "./DoughnutChart";
import PieChart from "./PieChart";
import PolarChart from "./PolarChart";
import RadarChart from "./RadarChart";

const ChartsPage = () => {
  return (
    <MDBContainer>
      <div id='charts'>
        <section>
          <MDBRow className='mb-4'>
            <MDBCol md='12' lg='4' className='mb-4'>
              <LineChart/>
            </MDBCol>
            <MDBCol md='12' lg='4' className='mb-4'>
              <RadarChart/>
            </MDBCol>
            <MDBCol md='12' lg='4' className='mb-4'>
              <BarChart/>
            </MDBCol>
          </MDBRow>
          <MDBRow className='mb-4'>
            <MDBCol md='12' lg='4' className='mb-4'>
              <PolarChart/>
            </MDBCol>
            <MDBCol md='12' lg='4' className='mb-4'>
              <PieChart/>
            </MDBCol>
            <MDBCol md='12' lg='4' className='mb-4'>
              <DoughnutChart/>
            </MDBCol>
          </MDBRow>
          <MDBRow className='mb-3'>
            <MDBCol md='12' lg='4' className='mb-4'>
              <MDBCard narrow>
                <MDBView cascade className='gradient-card-header blue'>
                  <h5 className='mb-0'>Polar chart</h5>
                </MDBView>
                <MDBCardBody className='text-center py-5'>
                  <MDBSimpleChart
                    strokeColor='green'
                    strokeWidth={3}
                    width={100}
                    height={100}
                    percent={56}
                    labelFontWeight='normal'
                  />
                </MDBCardBody>
              </MDBCard>
            </MDBCol>
            <MDBCol md='12' lg='4' className='mb-4'>
              <MDBCard narrow>
                <MDBView cascade className='gradient-card-header blue'>
                  <h5 className='mb-0'>Pie chart</h5>
                </MDBView>
                <MDBCardBody className='text-center py-5'>
                  <MDBSimpleChart
                    strokeColor='red'
                    strokeWidth={3}
                    width={100}
                    height={100}
                    percent={76}
                    labelFontWeight='normal'
                  />
                </MDBCardBody>
              </MDBCard>
            </MDBCol>
            <MDBCol md='12' lg='4' className='mb-4'>
              <MDBCard narrow>
                <MDBView cascade className='gradient-card-header blue'>
                  <h5 className='mb-0'>Doughnut chart</h5>
                </MDBView>
                <MDBCardBody className='text-center py-5'>
                  <MDBSimpleChart
                    strokeColor='grey'
                    strokeWidth={3}
                    width={100}
                    height={100}
                    percent={100}
                    labelFontWeight='normal'
                  />
                </MDBCardBody>
              </MDBCard>
            </MDBCol>
          </MDBRow>
        </section>
      </div>
    </MDBContainer>
  );
};

export default ChartsPage;
This is my LineChartPage;
import React from 'react';
import {
  MDBCard,
  MDBCardBody,
  MDBView
} from 'mdbreact';

import { Line } from 'react-chartjs-2';

const lineChartData = {
  labels: ['January', 'February', 'March', 'April', 'May', 'June', 'July'],
  datasets: [
    {
      label: 'My First dataset',
      data: [65, 59, 80, 81, 56, 55, 40],
      backgroundColor: 'rgba(105, 0, 132, .2)',
      borderColor: ['rgba(200, 99, 132, .7)'],
      borderWidth: 2
    },
    {
      label: 'My Second dataset',
      data: [28, 48, 40, 19, 86, 27, 90],
      backgroundColor: ['rgba(0, 137, 132, .2)'],
      borderColor: ['rgba(0, 10, 130, .7)'],
      borderWidth: 2
    }
  ]
};

const LineChart = () => {
  return (
            <MDBCard narrow>
              <MDBView cascade className='gradient-card-header blue'>
                <h5 className='mb-0'>Line chart</h5>
              </MDBView>
              <MDBCardBody>
                <Line data={lineChartData} height={200} />
              </MDBCardBody>
            </MDBCard>
  );
};

export default LineChart;
And this is my ModalFluidPage.js;
import React, { Component } from 'react';
import { MDBContainer, MDBBtn, MDBModal, MDBModalBody, MDBModalHeader, MDBModalFooter } from 'mdbreact';

class FluidModal extends Component {
state = {
  modal8: false,
  modal9: false
}

toggle = nr => () => {
  let modalNumber = 'modal' + nr
  this.setState({
    [modalNumber]: !this.state[modalNumber]
  });
}

render() {
  return (
    <MDBContainer>
      <MDBBtn color="info" onClick={this.toggle(8)}>Top</MDBBtn>
      <MDBModal isOpen={this.state.modal8} toggle={this.toggle(8)} fullHeight position="top">
        <MDBModalHeader toggle={this.toggle(8)}>MDBModal title</MDBModalHeader>
        <MDBModalBody>
          Lorem ipsum dolor sit amet, consectetur adipisicing elit, sed do eiusmod tempor incididunt ut labore et dolore
          magna aliqua. Ut enim ad minim veniam, quis nostrud exercitation ullamco laboris nisi ut aliquip ex ea commodo
          consequat.
        </MDBModalBody>
        <MDBModalFooter>
          <MDBBtn color="secondary" onClick={this.toggle(8)}>Close</MDBBtn>
          <MDBBtn color="primary">Chart Update</MDBBtn>
        </MDBModalFooter>
      </MDBModal>
    </MDBContainer>
    );
  }
}

export default FluidModal;
Konrad Stępień staff commented 6 years ago
Hi @cokicoki,
Can you prepare for me a snippet? Or send me a sample project on GitHub?
cokicoki free commented 6 years ago
Hi Konrad,
What is the snippet that you mean? The Attachment code above is the snippet or not? I don't have github at this moment. Pls adv.Thanks.
Konrad Stępień staff commented 6 years ago
Hi @cokicoki,
Can you test this code?
<MDBCol md="12" lg="4" className="mb-4">
  <MDBCard narrow>
    <MDBView cascade className="gradient-card-header blue">
      <h5 className="mb-0">Doughnut chart</h5>
    </MDBView>
    <MDBCardBody
      className="text-center py-5"
      onClick={() => {
        console.log("click");
        this.toggle();
      }}
      style={{ cursor: "pointer" }}
    >
      <MDBSimpleChart
        strokeColor="grey"
        strokeWidth={3}
        width={100}
        height={100}
        percent={100}
        labelFontWeight="normal"
      />
      <MDBModal
        isOpen={this.state.modal}
        toggle={()=>this.toggle()}
        fullHeight
        position="top"
      >
        <MDBSimpleChart
          strokeColor="grey"
          strokeWidth={3}
          width={100}
          height={100}
          percent={100}
          labelFontWeight="normal"
        />
      </MDBModal>
    </MDBCardBody>
  </MDBCard>
</MDBCol>
This is ChartPage.js;. But you have to make styles for a better look.
Best, Konrad
cokicoki free commented 6 years ago
I will try. Thank you Konrad.
Konrad Stępień staff commented 6 years ago
Of course, you can refactor this code. If this works correctly for you, you can also remove double code.
And I forgot to write code about the state and the function. There is this:
class ChartsPage extends React.Component {
  state = {
    modal: false
  };
  toggle = () => {
    this.setState({
      modal: !this.statemodal
    });
  };
  render() {
    return (
      <MDBContainer>
        <div id="charts">
          <section>
Please tell me if you have the problems or something else.
Best, Konrad.

Hi @cokicoki,
You should prepare in your project a component which will open new modal or something else.
Then set onClick property on your chart and then you can make something like this:
<div>
{this.state.display && <div> my styled component with chars property </div>}
</div>
then you can style your div/component.
Next step: You can import chars for this component, and make for this component styles with fixed position. And then you can in JS set fullscreen.
Unfortunately, I can't prepare this project for you, but I think that this short guide will help you achieve your goal, if necessary I can help you in the next steps.
Best, Konrad.
FREE CONSULTATION
Hire our experts to build a dedicated project. We'll analyze your business requirements, for free.
Opened
- ForumUser: Free
- Premium support: No
- Technology: MDB React
- MDB Version: 4.23.0
- Device: PC
- Browser: Mozilla Firefox
- OS: MS Windows 7
- Provided sample code: No
- Provided link: Yes