Topic: Doughnut chart update datalabels plugin error

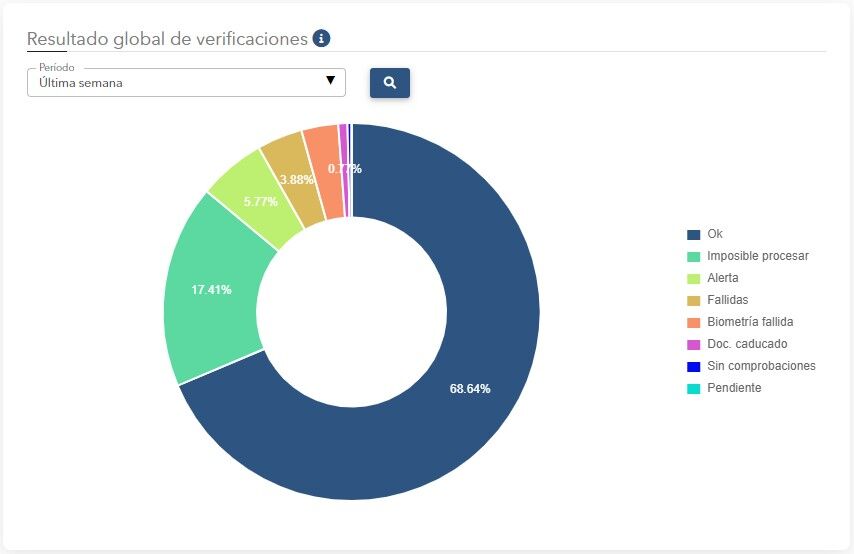
Expected behavior The percentage data labels should be calculated properly when updating the doughnut chart data.
Actual behavior The percentage data labels for doughnut charts is well calculated and displayed when the chart is created but not when the data is updated. I'm using MDB Pro 5.0.0.
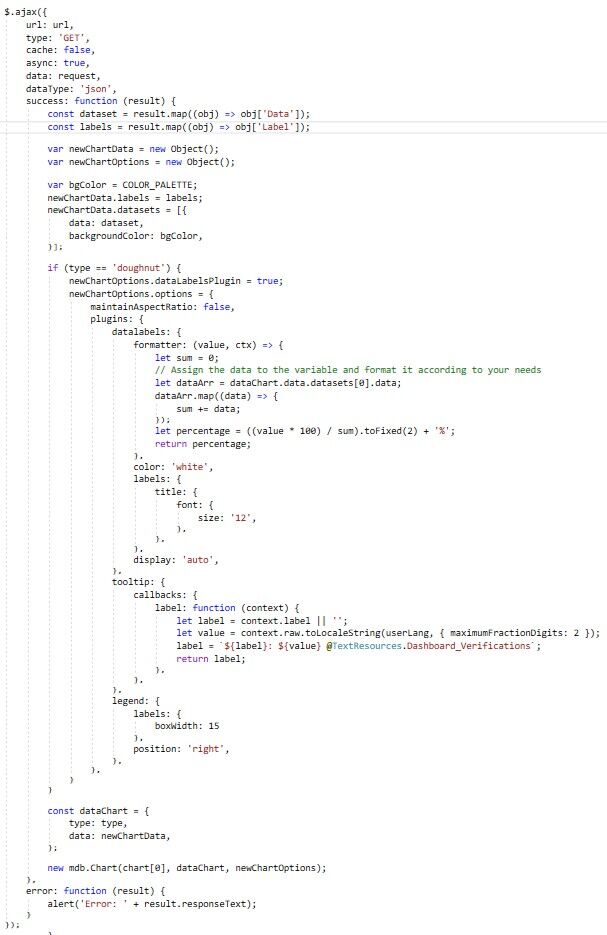
Creating the chart I have the correct percentages as datalabels:
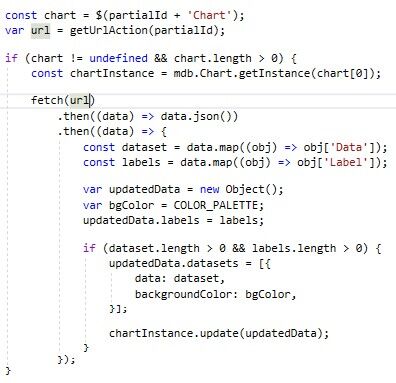
Updating the chart I got the following error:
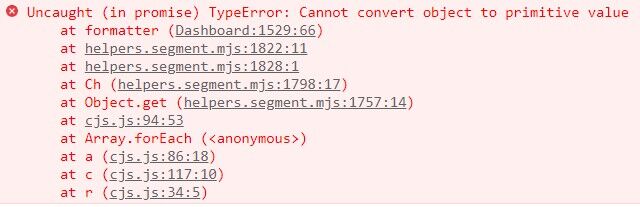
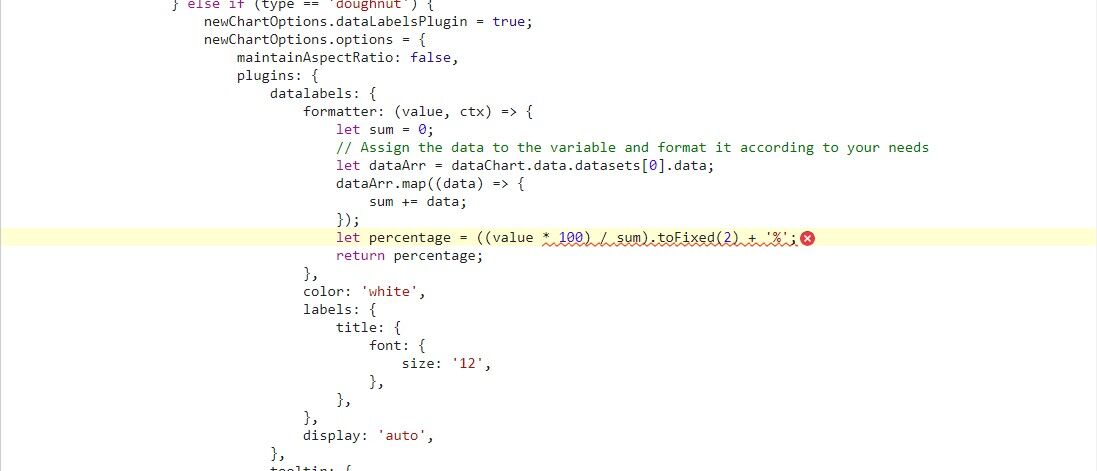
When the chart is updated, the type of value property is not a number.
In another application using MDB Pro 3.10.2 it works properly when the chart is created and updated. But after version 4.X this problem happend.
Resources (screenshots, code snippets etc.)
I've been waiting for a week...
Is there any update on this issue?
Thank you.
Mateusz Lazaru staff commented 3 years ago
This issue is already on our 'todo' list. It's not fixed yet.
I've just checked that updating the MDB version from 3.10.2 to 5.0.0 in the project that works properly, the same chart works when it is created but it crashes when chartInstance.update(updatedData) is called.
So please, can you review this issue using the plugin ChartDataLabels through tag:
newChartOptions.dataLabelsPlugin = true?
Thank you.

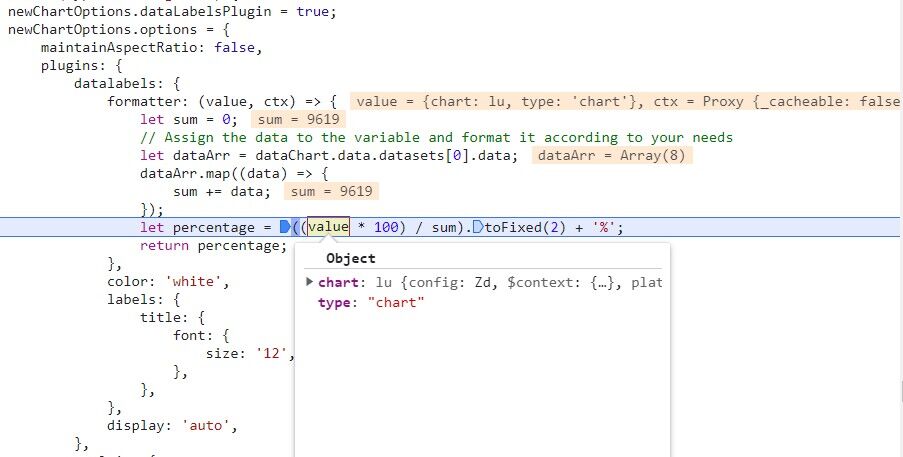
formatter: (value, ctx) => {
value = {chart: lu, type: 'chart}, ctx = Proxy {_cacheable: false}
}
Callback function inside formatter takes value argument, which - I believe - is a typeof Number. Then you assign to this variable an object. Does it work if you delete this assignation?
neocheck premium commented 3 years ago
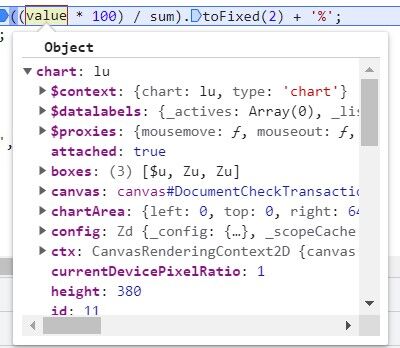
I don't assign any object to "value" argument. The following line is showed by Chrome developer's tool to inform the typeOf "value" and "ctx" arguments when you're debugging, like "sum" and "dataArr" values:

Mateusz Lazaru staff commented 3 years ago
I'm sorry, my mistake.
Well, MDB charts could behave different in different version of package, specially when we compare different major versions. One of the reasons is updating dependencies - in this example it may be related to updating chartjs to newer version.That's why this code could work in older version of MDB and now throw an error.
Does this error occures while creating new chart or only while updating existing one?Are you able to recreate this problem using snippets?
neocheck premium commented 3 years ago
This problem occurs only while updating existing one. The first time it is rendered after creating the datalabels are perfect.
I'll try to recreate this using snippets.
Thank you.
neocheck premium commented 3 years ago
Hello again,
Here you can find the snippet with the error sample: https://mdbootstrap.com/snippets/standard/neocheck/4393235
Mateusz Lazaru staff commented 3 years ago
Thank you. We will check if this is MDB related issue, or bug in currently used chart.js version and try to fix this.
neocheck premium commented 3 years ago
Hello. Is there any update on this issue?
Thank you.
neocheck premium commented 3 years ago
Is this bug fixed in the new MDB update? Thank you.
FREE CONSULTATION
Hire our experts to build a dedicated project. We'll analyze your business requirements, for free.
Answered
- ForumUser: Premium
- Premium support: Yes
- Technology: MDB Standard
- MDB Version: MDB5 5.0.0
- Device: PC
- Browser: Chrome
- OS: Windows
- Provided sample code: No
- Provided link: No