Topic: Change Pie/Doughnut Chart Height

Hia,
I'm looking to change the height of my charts but can't find a setting for it.
I want to shrink the padding or space on either side of the chart to increase the overall size. Since the height is dynamic (since it's a row/col) that should be fine however, I can't figure out how to shrink the space on either side.
Does this make sense?
Thanks!
<div class="row">
<div class="col-md-3">
<div class="card">
<div class="card-body">
<div class="row">
<div class="col">
<canvas id="doughnut-chart1" class=""></canvas>
<script type="text/javascript">
$(document).ready(function(){
const dataDoughnut1 = {
type: 'doughnut',
data: {
labels: ['Label1', 'Label2', 'Label3'],
datasets: [
{
label: 'Label4',
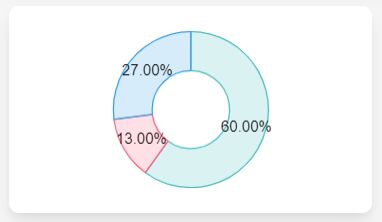
data: [60, 13, 27],
backgroundColor: [
'rgba(75, 192, 192, 0.2)',
'rgba(255, 99, 132, 0.2)',
'rgba(54, 162, 235, 0.2)',
],
borderColor: [
'rgba(75, 192, 192, 1)',
'rgba(255,99,132,1)',
'rgba(54, 162, 235, 1)',
],
borderWidth: 1,
},
],
},
};
const dataDoughnutoptions1 = {
dataLabelsPlugin: true,
options: {
legend: {
display: false,
},
plugins: {
datalabels: {
formatter: (value, ctx) => {
let sum = 0;
let dataArr = dataDoughnut1.data.datasets[0].data;
dataArr.map((data) => {
sum += data;
});
let percentage = ((value * 100) / sum).toFixed(2) + '%';
return percentage;
},
color: 'black',
labels: {
title: {
font: {
size: '12',
},
},
},
},
},
},
};
new mdb.Chart(document.getElementById('doughnut-chart1'), dataDoughnut1, dataDoughnutoptions1);
})
</script>
</div>
</div>
</div>
</div>
</div>
Seems like height is based on the width of the chart and adds padding or space on top or bottom. I want the canvas size to be the same as it was on the old version, aka dynamic height instead of a forced square (while still using the current version).
Current version of charts canvas size:
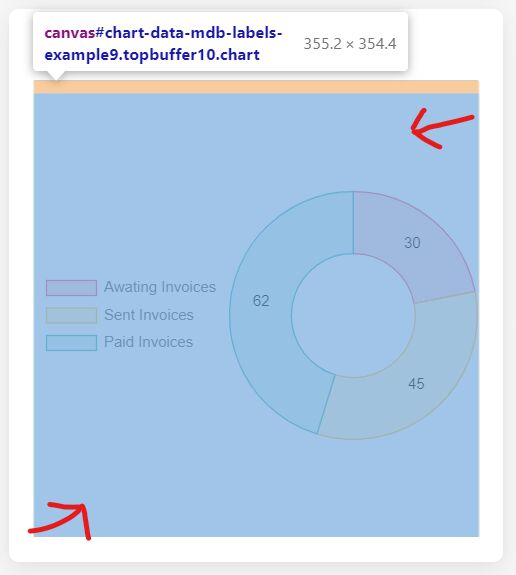
Old version of charts canvas size:

There is an easier way to resolve your problem.
As far as I know, the previous version of Chart.js had for this type of chart 2 as the default value of aspectRatio. It changed to 1. To counteract that you have to set in options aspectRatio to 2 on Pie/Doughnut charts with the legend on the side. Example snippet:https://mdbootstrap.com/snippets/standard/kpienkowska/4151736

There is such option:
        layout: {
            padding: {
                left: -20,
                right: -20,
                top: -10,
                bottom: -10
            }
        },
It will not work fine with really small charts, but it I hope it will help you. https://mdbootstrap.com/snippets/standard/mlazaru/4140719#js-tab-view
stefangregg priority commented 4 years ago
Do yall have a list of all available options on the docs?
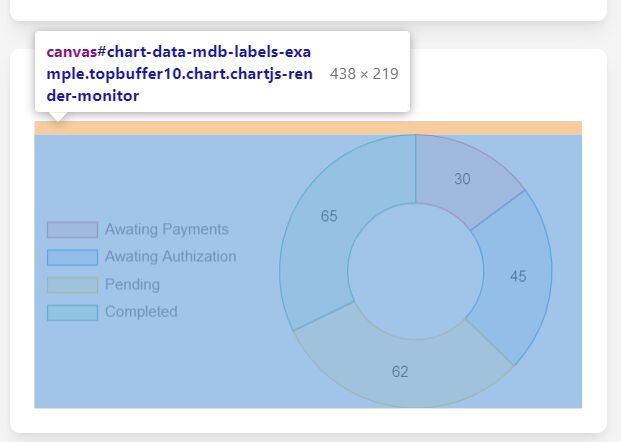
I have copied my code to this snippet: https://mdbootstrap.com/snippets/standard/stefangregg/4151413
However, I am still getting that weird padding on the top and bottom of the chart. Even messing around with the padding option, the canvas itself is still square.
In the old version of the charts, the size of the canvas was dynamic (see the last image in the question). How can I replicate this behavior in the new version?
I think it's not possible to shrink outside space but if your point is to avoid overflowing datalabels, you could try set min-width and min-height for card and decrease padding-x for card-body.
Does it help in any way?
https://mdbootstrap.com/snippets/standard/mlazaru/4140719#html-tab-view
stefangregg priority commented 4 years ago
Well, it seems that the canvas is a square based on the width. I have attached an additional image showing what I mean when I say padding. Is there not an attribute or option to set a fixed height or remove padding at the top or bottom? I don't want to change the size of the card itself.
FREE CONSULTATION
Hire our experts to build a dedicated project. We'll analyze your business requirements, for free.
Resolved
- ForumUser: Priority
- Premium support: Yes
- Technology: MDB Standard
- MDB Version: MDB5 4.2.0
- Device: All
- Browser: All
- OS: All
- Provided sample code: No
- Provided link: No